MSFT Testing Key Resistance: Stock Gains 1.08% (October 15, 2026)
On October 15, 2026: price 539.44 USD, trend uptrend, RSI 65.1, support 493.78, resistance 543.45. technical analysis of msft stock. MSFT Testing Key…
Trend & Price Action
The short-term structure is constructive: Microsoft’s price is above the 20-day simple moving average (SMA), at $518.46, and the 50-day SMA, at $504.95. The 20-day average has risen 2.03% over five trading days, a sign that recent strength is extending beyond a single session. There has been no fresh crossover between the averages, however, so the trend signal comes from price holding above both lines rather than a new moving-average event. At $539.44, the stock is close to its 20-day resistance of $543.45 and sits at 92% of its 20-day trading range. That leaves less room before the nearby ceiling, even as the three-month high of $551.15 shows that higher prices have been reached within the period. The chart places this advance in context: price is pressing resistance, not breaking into uncharted territory.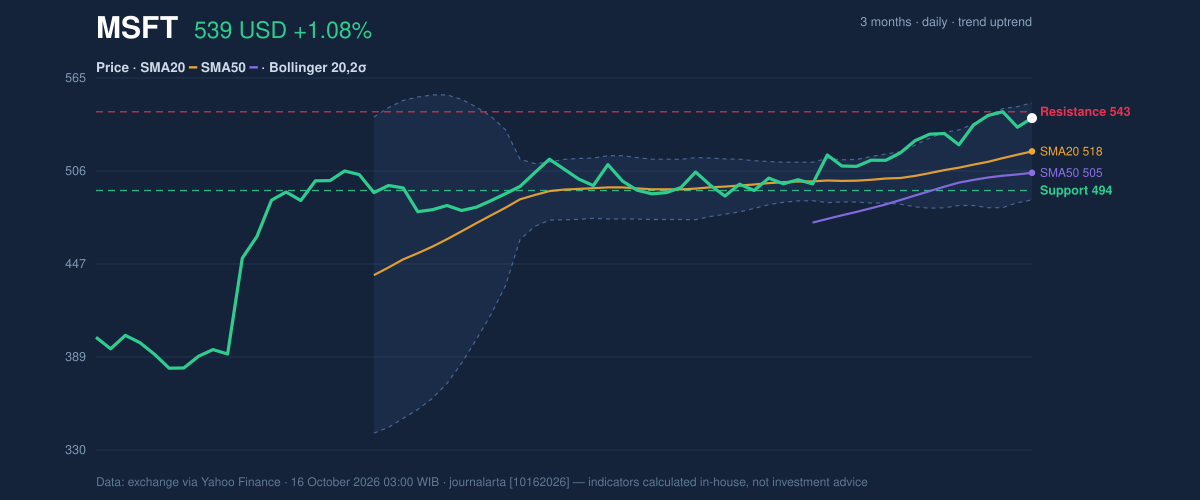
Oscillators & Momentum
Momentum indicators support the upward move but do not point to an extreme reading. The RSI is 65.1, classified as neutral; the Relative Strength Index compares recent gains and losses, and this reading suggests strength without the more stretched conditions associated with an overbought signal. The Stochastic readings are also neutral, with %K at 76.1 and %D at 76.9. Their close alignment indicates that short-term momentum is firm, but not accelerating sharply. The Moving Average Convergence Divergence indicator (MACD) adds confirmation: MACD at 12.042 is above its 10.741 signal line, with a positive 1.301 histogram. In plain terms, the measure of trend momentum remains positive. Together, the signals show an advance with supportive momentum, but one already approaching resistance.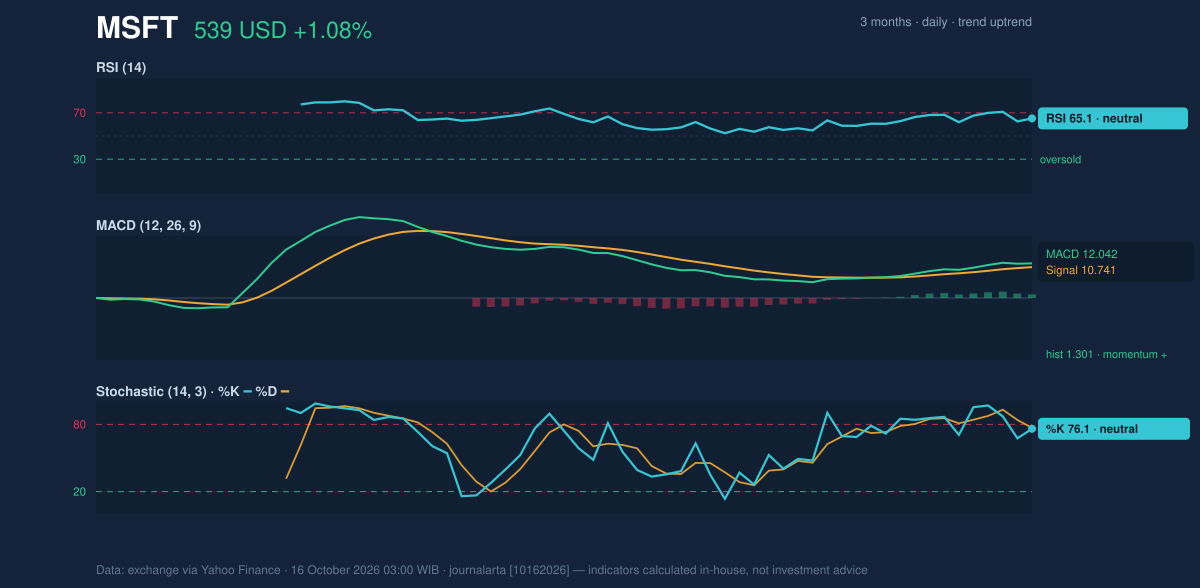
Volatility & Volume
Microsoft’s Bollinger Bands—bands that widen or narrow with price volatility—show a normal width of 11.8%, rather than a squeeze that might precede a sharp expansion in movement. The %B reading of 84% places the price in the upper part of the band, consistent with recent strength but also with a market nearing the band’s $549.09 upper edge. The middle band is $518.46 and the lower band is $487.82. Average True Range (ATR), a measure of typical price movement, is $11.35, or 2.1% of the latest price, indicating moderate volatility. Volume was 24.132 million shares against a 20-day average of 23.057 million—roughly normal activity—while OBV, which tracks the balance of volume on rising and falling sessions, was climbing. That combination offers modest confirmation: buyers participated, but volume did not surge enough to make the breakout case conclusive.Key Levels & Scenarios
The immediate test is $543.45 resistance, just above the latest close. A sustained move through that level would put the three-month high of $551.15 in focus. Failure to clear resistance, by contrast, could leave the stock consolidating after its recent gains. On the downside, the rising 20-day SMA at $518.46 is the nearest key reference for the trend. Below it, the 50-day SMA at $504.95 and 20-day support at $493.78 mark deeper levels to watch. A decline through support would weaken the current bullish structure; until then, the price remains above both moving averages.Technical Verdict: HOLD (wait & see)
Microsoft’s indicators lean positive, but the stock’s proximity to resistance argues for caution rather than a decisive directional reading. The strongest supporting signals are the rising 20-day SMA with price above both moving averages, positive MACD momentum, and rising OBV on near-normal volume. The RSI and Stochastic remain neutral, while the price is already near the upper Bollinger Band and 20-day resistance. Core reading: the trend is intact, but confirmation above nearby resistance is still missing. This verdict is invalidated if the price falls below $493.78, the 20-day support level. - Ideal entry range: $518.46–$504.95, around the 20-day and 50-day SMAs. - Exit target: $543.45–$551.15, spanning 20-day resistance and the three-month high. - Stop-loss protection: $493.78, at 20-day support. For non-traders, the indicators show Microsoft rising, but its next move depends on whether the stock can get past resistance or hold its support.Market data: exchange data via Yahoo Finance, as of October 16, 2026, 03:00 WIB. Technical analysis is not an investment recommendation.
Why MSFT is in focus today
- Uptrend confirmed (5-day change 3.22%)
Selected automatically from 32 NASDAQ (US) stocks by a technical-signal score with daily weighted randomisation — not a recommendation.
Summary Data MSFT
| Last price | 539.44 USD |
| Change 1 day / 5 days / 1 month | 1.08% / 3.22% / 8.38% |
| Trend / MA-cross | uptrend / none |
| SMA20 / SMA50 | 518.46 / 504.95 |
| RSI (14) / Stochastic %K | 65.1 / 76.1 |
| Bollinger %B / ATR | 84% / 11.35 |
| Support / Resistance 20 days | 493.78 / 543.45 |
| Data as of | 16 October 2026 03:00 WIB |
Disclaimer: This technical analysis is generated automatically from exchange data (via Yahoo Finance) and indicators calculated by JournalArta, for information and education only. The verdict and the entry, target and stop-loss levels are not investment advice or a solicitation to buy or sell any security. Investment decisions and their risks rest solely with the reader.
Track MSFT stock price daily: live levels, support/resistance and our full MSFT analysis history.