NFLX Stock Gains 2.89%, Testing Key Resistance In Focus
On October 15, 2026: price 72.61 USD, trend sideways, RSI 51.9, support 67.06, resistance 73.36. technical analysis of nflx stock. NFLX Stock Gains — full…
Why NFLX is in focus today
- One-day move of 2.89%, about 1.3× its average daily range (ATR)
- Not covered by JournalArta in the last 14 days
Selected automatically from 32 NASDAQ (US) stocks by a technical-signal score with daily weighted randomisation — not a recommendation.
Trend & Price Action
Netflix is trading above its 20-day simple moving average (SMA) of $70.38, but remains below its 50-day average of $75.16. That split points to a short-term recovery within a broader, still-unsettled pattern rather than a confirmed change in trend. The 20-day average is sloping down, and no new moving-average crossover has formed. The share price has gained 1.45% over five days but is down 3.59% over one month. At 88% of its 20-trading-day range, it is pressing resistance at $73.36; the upper Bollinger Band, a measure of the stock’s recent price boundary, sits at $73.69. The nearby barriers make the next move more informative than the one-day gain alone. As shown in the chart, the price is above its short-term average but approaching both resistance and the upper band.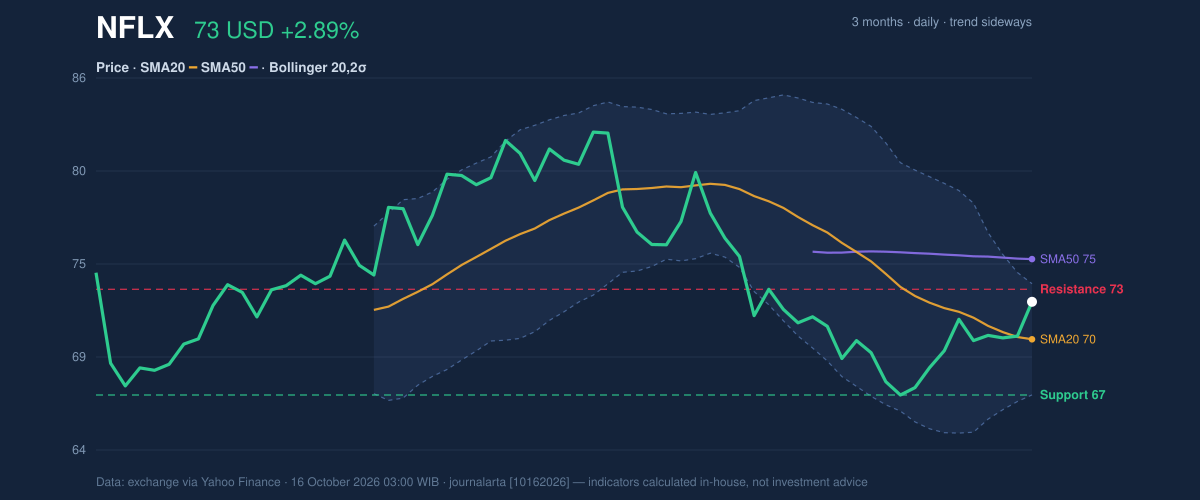
Oscillators & Momentum
The indicators do not yet agree on how durable the advance is. The RSI is 51.9, a neutral reading that suggests neither strong buying nor selling pressure. Meanwhile, the Stochastic is overbought, with %K at 93.0 and %D at 78.6. That measure compares the latest close with the stock’s recent price range; a high reading can signal that a rally has moved quickly, though it does not by itself predict a reversal. The MACD histogram is positive at 0.508, with MACD at -1.187 above its signal line at -1.695. This indicates improving momentum, even though both MACD lines remain below zero—a sign that the recovery has not yet erased the weaker trend backdrop. The signal is encouraging, but not conclusive.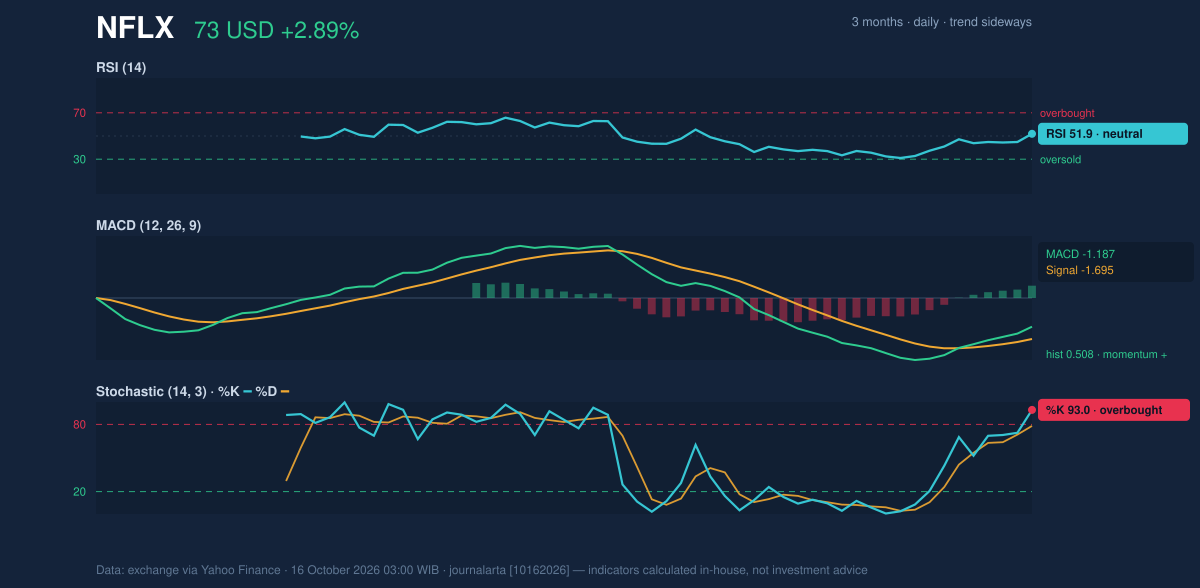
Volatility, Volume & Key Levels
The Bollinger Band width is 9.4%, described as normal rather than unusually compressed or expanded. The price’s position at 84% of the band range shows it is closer to the upper boundary than the lower one. Average true range (ATR), a measure of typical daily movement, is $1.65, or 2.3% of the share price, indicating moderate volatility—not an unusually large move by this stock’s recent standards. Trading volume was 40,275,900 shares, roughly in line with its 20-day average of 38,718,790. On-balance volume (OBV), which tracks whether volume is heavier on rising or falling sessions, is rising. That offers some confirmation that participation has supported the advance, without showing a dramatic surge in activity. The key near-term test is whether Netflix can clear $73.36 resistance and hold above the upper band at $73.69. A sustained break above that area would strengthen the case that momentum is extending; rejection there would leave the stock vulnerable to a pullback toward $70.38, its 20-day average. Below that, the 20-day support at $67.06 is a more important downside reference. The three-month range remains wide, from $65.08 to $83.60.Technical Verdict: HOLD (wait & see)
The indicators support a cautious, conditional reading rather than a clear directional signal. - Entry range: $70.38–$73.36, bounded by the 20-day SMA and 20-day resistance. - Exit target: $73.69, the upper Bollinger Band; this is a technical reference, not a forecast. - Stop-loss protection: $67.06, the 20-day support level. - Invalidation: The verdict is invalidated if price falls below $67.06. The HOLD view reflects a price above the 20-day average, positive MACD momentum and rising OBV, offset by a falling average, resistance overhead and an overbought Stochastic reading. In plain English, the rebound has some support, but the chart has not yet settled whether it can push through resistance.Data Table
| Indicator | Reading |
|---|---|
| Last price | $72.61 |
| Daily change | +2.89% |
| SMA20 / SMA50 | $70.38 / $75.16 |
| RSI(14) | 51.9 (neutral) |
| Stochastic %K / %D | 93.0 / 78.6 (overbought) |
| MACD / signal / histogram | -1.187 / -1.695 / 0.508 |
| Support / resistance | $67.06 / $73.36 |
| ATR(14) | $1.65 (2.3%) |
Summary Data NFLX
| Last price | 72.61 USD |
| Change 1 day / 5 days / 1 month | 2.89% / 1.45% / -3.59% |
| Trend / MA-cross | sideways / none |
| SMA20 / SMA50 | 70.38 / 75.16 |
| RSI (14) / Stochastic %K | 51.9 / 93.0 |
| Bollinger %B / ATR | 84% / 1.65 |
| Support / Resistance 20 days | 67.06 / 73.36 |
| Data as of | 16 October 2026 03:00 WIB |
Disclaimer: This technical analysis is generated automatically from exchange data (via Yahoo Finance) and indicators calculated by JournalArta, for information and education only. The verdict and the entry, target and stop-loss levels are not investment advice or a solicitation to buy or sell any security. Investment decisions and their risks rest solely with the reader.
Track NFLX stock price daily: live levels, support/resistance and our full NFLX analysis history.