PDD Stock Analysis: Gains 1.19%, Testing Key Resistance
On October 15, 2026: price 82.42 USD, trend sideways, RSI 58.4, support 75.38, resistance 82.42. technical analysis of pdd stock. PDD Stock Analysis — full…
Why PDD is in focus today
- Closed at a 20-day high (82.42)
Selected automatically from 32 NASDAQ (US) stocks by a technical-signal score with daily weighted randomisation — not a recommendation.
Trend & Price Action
PDD is above its 20-day simple moving average, or SMA, at $79.02, and just above its 50-day SMA at $82.40. The 20-day average has risen 1.04% over five days, suggesting near-term price support is improving. But there has been no new crossover between the averages, so the chart does not yet show a fresh signal that the broader trend has decisively changed. The closing price also matches the stated 20-day resistance of $82.42, placing the shares at 100% of the range between that resistance and support at $75.38. That is a meaningful test: staying above the 50-day average may help sustain the recovery, but a close at resistance is not the same as a confirmed break through it. PDD remains below its three-month high of $93.19 and above its three-month low of $74.72. As shown in the chart, the price is pressing against the upper Bollinger Band, while the moving averages and nearby levels show where a pullback or a breakout would become more consequential.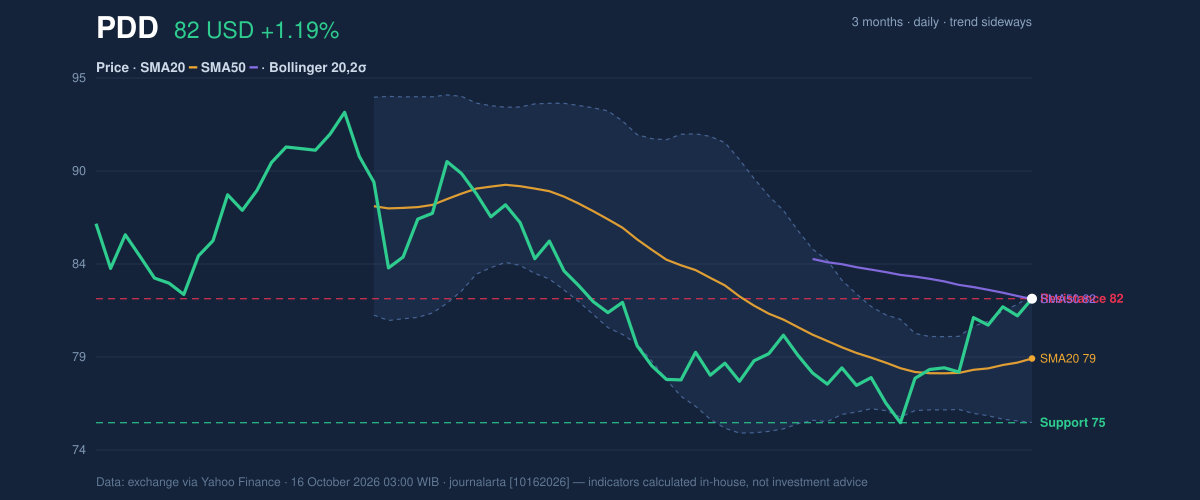
Oscillators & Momentum
The indicators do not tell one consistent story. The RSI is 58.4, a neutral reading that points to positive but not extreme momentum. The MACD, a measure of the relationship between short- and longer-term price momentum, is more constructive: its value is 0.008 versus a signal line of -0.784, with a positive 0.792 histogram. That configuration indicates improving momentum, although it does not by itself establish that resistance has been cleared. The Stochastic oscillator is the counterweight. %K at 84.1 and %D at 78.9 are in overbought territory, meaning the recent rise has been rapid relative to the stock’s recent trading range. “Overbought” is not a prediction of an immediate fall; it signals that further gains may require fresh demand, while leaving the price more vulnerable to a pause. The chart’s RSI, MACD and Stochastic readings show that positive momentum is present, but its strength is not equally confirmed across all three measures.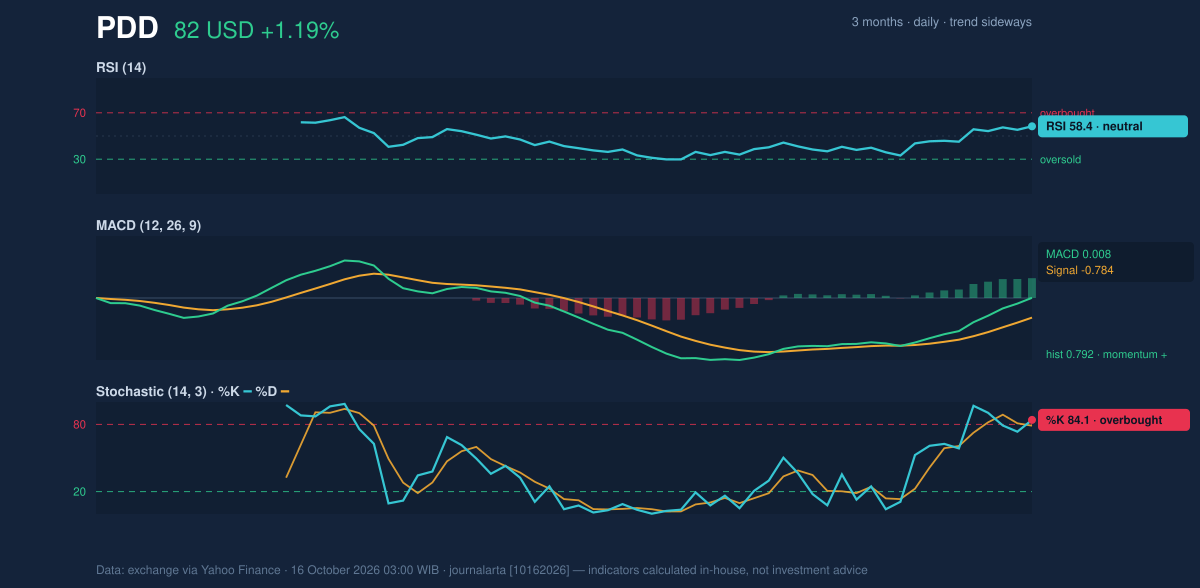
Volatility, Volume & Key Levels
PDD’s Bollinger Band reading adds to the case for caution at the range high. The bands are at $75.40 below and $82.65 above, with a normal 9.2% width; the stock’s position at 97% of the band range places it close to the upper edge. The bands are not unusually narrow, so the data do not point to a compressed setup ahead of a likely sharp move. Instead, the price is already testing the top of its current volatility envelope. Trading volume was 5,814,500 shares, around 1.0 times the 20-day average of 5,685,220, while on-balance volume, a running measure of whether volume is stronger on rising or falling sessions, is rising. That supports the advance, but participation is close to normal rather than an exceptional surge. The average true range is $1.95, or 2.4% of the share price, indicating moderate day-to-day movement. A sustained move above $82.42 resistance would strengthen the case that the recent range is giving way. Failure to hold the $79.02 20-day SMA would weaken the short-term structure; a deeper decline toward $75.38 support would test the lower boundary of the 20-day range.Technical Verdict: HOLD
HOLD (wait & see) is the clearest reading of the mixed signals. The rising 20-day SMA and positive MACD support the advance, and rising OBV suggests buyers remain engaged. Against that, the stock is at 20-day resistance, near the upper Bollinger Band, and the Stochastic is overbought. - Ideal entry range: $79.02–$82.40, using the 20-day SMA and 50-day SMA as reference levels rather than assuming resistance has broken. - Exit target: $82.65, the upper Bollinger Band. - Stop-loss protection: $75.38, the 20-day support level. - Invalidation: The verdict is invalidated if price falls below $75.38. In plain English, the chart shows improving momentum but not enough confirmation to resolve whether PDD can move beyond its recent ceiling. This technical reading is not an investment recommendation.| Market data | Reading |
|---|---|
| Latest price | $82.42 |
| Daily change | +1.19% |
| 20-day / 50-day SMA | $79.02 / $82.40 |
| Bollinger Bands | $75.40 / $79.02 / $82.65 |
| RSI / Stochastic | 58.4 / 84.1 (%K), 78.9 (%D) |
| MACD / signal / histogram | 0.008 / -0.784 / 0.792 |
| 20-day support / resistance | $75.38 / $82.42 |
Summary Data PDD
| Last price | 82.42 USD |
| Change 1 day / 5 days / 1 month | 1.19% / 5.32% / 6.03% |
| Trend / MA-cross | sideways / none |
| SMA20 / SMA50 | 79.02 / 82.40 |
| RSI (14) / Stochastic %K | 58.4 / 84.1 |
| Bollinger %B / ATR | 97% / 1.95 |
| Support / Resistance 20 days | 75.38 / 82.42 |
| Data as of | 16 October 2026 03:00 WIB |
Disclaimer: This technical analysis is generated automatically from exchange data (via Yahoo Finance) and indicators calculated by JournalArta, for information and education only. The verdict and the entry, target and stop-loss levels are not investment advice or a solicitation to buy or sell any security. Investment decisions and their risks rest solely with the reader.
Track PDD stock price daily: live levels, support/resistance and our full PDD analysis history.