AMAT RSI Oversold: Stock Drops 4.82% (October 16, 2026)
On October 16, 2026: price 409.29 USD, trend sideways, RSI 29.2, support 409.29, resistance 542.28. technical analysis of amat stock. AMAT RSI Oversold — full…
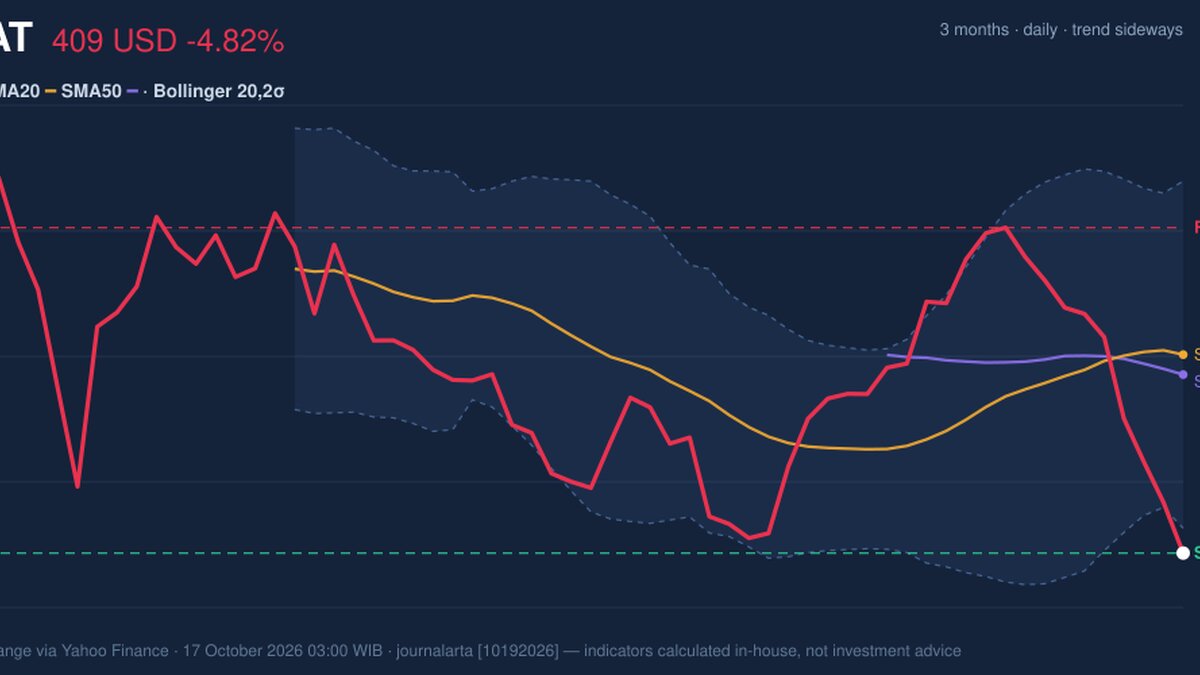
Why AMAT is in focus today
- Closed at a 20-day low (409.29)
- Trading near its 3-month low (407.26)
- Fresh golden cross: SMA20 crossed above SMA50
- RSI(14) at 29.2 — oversold zone
Selected automatically from 32 NASDAQ (US) stocks by a technical-signal score with daily weighted randomisation — not a recommendation.
Trend & Price Action
The stock lost 19.28% over five days and 7.94% over one month, putting it below both its 20-day average of US$490.37 and its 50-day average of US$482.21. That gap matters: short-term weakness has overwhelmed the recent improvement in the moving-average relationship. The 20-day average has crossed above the 50-day average, a pattern known as a golden cross and often read as evidence that the medium-term trend is improving. But the latest price action complicates that interpretation. The share price is now far below both averages, and the 20-day average’s slope remains positive. This suggests the crossover reflects earlier strength, while the sharp recent drop has not yet been absorbed by the trend indicators. The price sits at the bottom of its 20-day range and close to the three-month low of US$407.26. The nearest stated support is US$409.29; resistance is US$542.28. As shown in the chart, the gap between the current price and the moving averages highlights how much ground the shares would need to recover before the technical picture could look more balanced.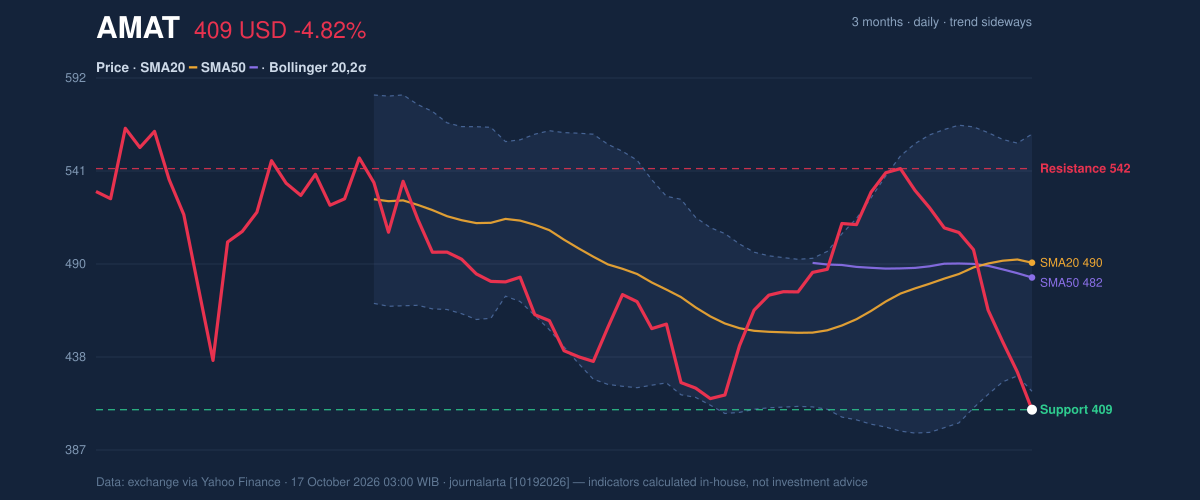
Oscillators & Momentum
The relative strength index, or RSI, is 29.2, in oversold territory. The Stochastic readings are lower still, with %K at 1.5 and %D at 3.9. These measures indicate that the recent decline has been unusually forceful; they can precede a rebound, but they do not establish that one has begun. The MACD, a trend-and-momentum measure, remains negative: its reading is -8.229, against a signal line of 3.177, while the histogram is -11.406. In plain terms, downward momentum is still dominant. The oversold readings point to the possibility of a pause or bounce, while the MACD warns that a durable reversal is unconfirmed.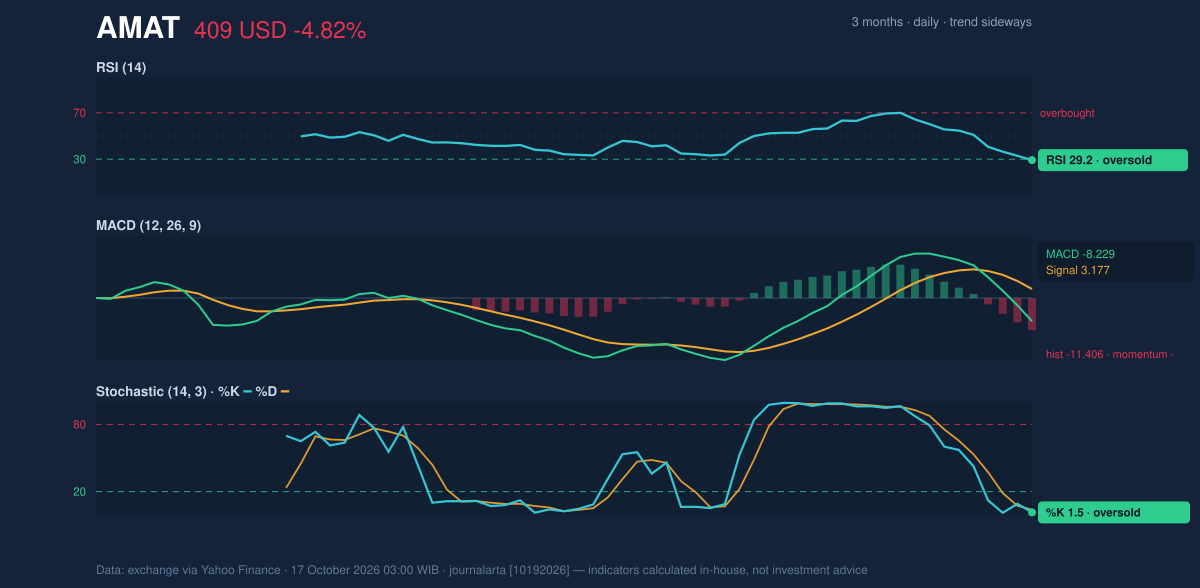
Volatility & Volume
The share price is below the lower Bollinger Band at US$419.42, with %B at -7%. Bollinger Bands widen as price swings increase; here, the 28.9% band width signals elevated volatility rather than a quiet base. A close beneath the lower band can reflect intense selling pressure, though it is not, on its own, proof that the decline has reached a lasting bottom. Average true range, a measure of typical price movement, is US$20.64, or 5.0% of the share price. That is a sizeable daily range relative to the stock’s level and means moves around the nearby support may be abrupt. Volume reinforces the caution. The latest session traded 8,536,500 shares, about 1.3 times the 20-day average, while on-balance volume (OBV)—a running measure that tracks whether volume accompanies rising or falling prices—was declining. Above-normal activity alongside falling OBV points to selling participation, not clear accumulation.Technical Verdict: HOLD (wait & see)
The technical evidence supports a wait-and-see stance: oversold readings make a rebound possible, but negative MACD, declining OBV and a price below both moving averages leave the downtrend pressure unresolved. The golden cross is a counterweight, not yet confirmation that buyers have regained control. - Ideal entry range: US$407.26–US$419.42, bounded by the three-month low and lower Bollinger Band; this is a technical reference zone, not a signal that a reversal has been confirmed. - Exit target: US$482.21–US$490.37, the 50-day and 20-day averages, where the price would face a test of overhead trend resistance. - Stop-loss protection: US$407.26, using the three-month low as the invalidation level. - Invalidation: The wait-and-see verdict is invalidated if the price falls below US$407.26. In plain English, the shares look stretched to the downside, but the selling signals remain strong enough that a recovery is not yet established. Data source: exchange data via Yahoo Finance, as of 17 October 2026, 03:00 WIB.Summary Data AMAT
| Last price | 409.29 USD |
| Change 1 day / 5 days / 1 month | -4.82% / -19.28% / -7.94% |
| Trend / MA-cross | sideways / golden |
| SMA20 / SMA50 | 490.37 / 482.21 |
| RSI (14) / Stochastic %K | 29.2 / 1.5 |
| Bollinger %B / ATR | -7% / 20.64 |
| Support / Resistance 20 days | 409.29 / 542.28 |
| Data as of | 17 October 2026 03:00 WIB |
Disclaimer: This technical analysis is generated automatically from exchange data (via Yahoo Finance) and indicators calculated by JournalArta, for information and education only. The verdict and the entry, target and stop-loss levels are not investment advice or a solicitation to buy or sell any security. Investment decisions and their risks rest solely with the reader.
Track AMAT stock price daily: live levels, support/resistance and our full AMAT analysis history.