HSBC Stock Technicals: Gains 1.22% on Friday, Momentum Weakens
On October 16, 2026: price 149.70 HKD, trend downtrend, RSI 42.8, support 142.60, resistance 161.60. technical analysis of hsbc stock. HSBC Stock Technicals —…
By Alistair Sterling
October 18, 20264 min read
HSBC Stock Technicals
HK$149.70, up 1.22% on the day, puts HSBC Holdings above its previous close but still below its key moving averages, leaving the latest bounce at odds with the broader price trend. The stock has gained 3.10% over five trading days, yet remains down 6.32% over a month. That split matters: short-term buying has emerged, but the available indicators do not yet confirm a sustained reversal.
Trend & Price Action
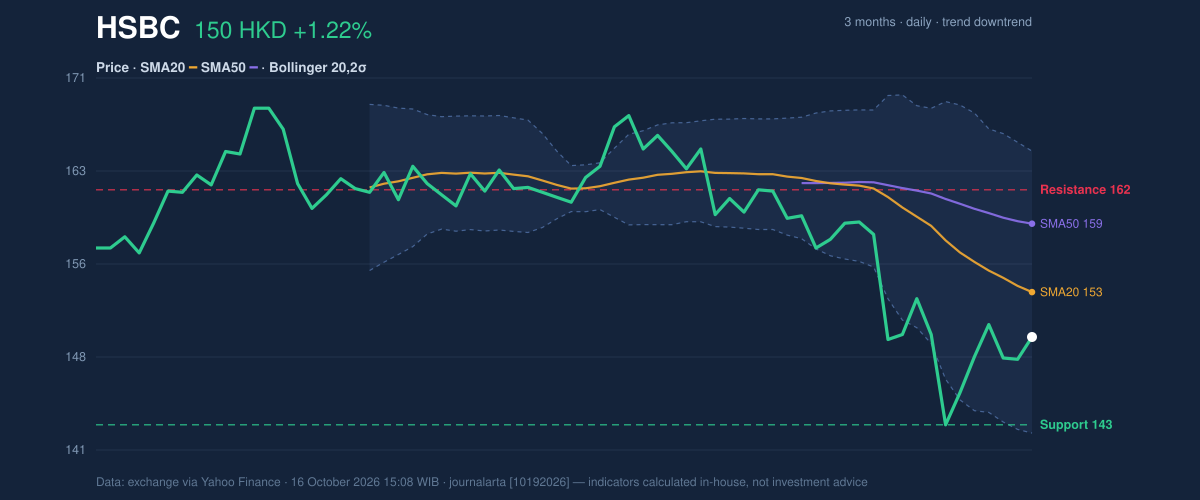
HSBC’s last price is HK$149.70, below its 20-day simple moving average (SMA) of HK$153.33 and 50-day SMA of HK$158.86. A simple moving average tracks the average closing price over a set period; trading beneath both measures signals that recent price action remains weaker than its medium-term reference points. The 20-day average is also falling, with its slope down 2.05% over five trading days. There has been no new moving-average crossover to suggest a change in trend.
The stock sits 37% of the way through its 20-trading-day range, between support at HK$142.60 and resistance at HK$161.60. It is closer to the lower boundary than the upper one, though not at the range floor. Its three-month high and low are HK$169.70 and HK$142.00, respectively, placing the recent low near the shorter-term support zone.
The daily rise is a counter-move, not yet a trend change.
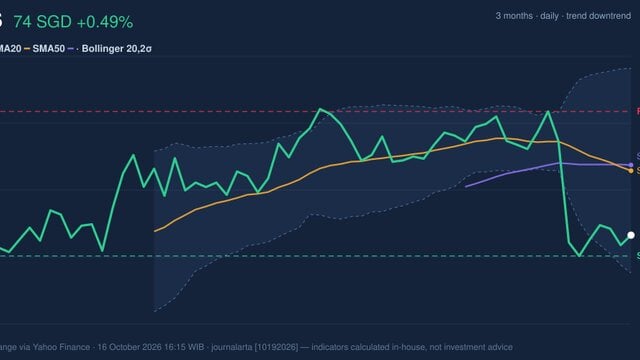
As shown in the chart, the price remains beneath the falling 20-day average, while the Bollinger middle band sits at the same HK$153.33 level. Bollinger Bands measure price relative to a moving average and its recent volatility; at 34% of the band width, HSBC is in the lower half of its range, but not pressed against the lower band at HK$141.93.
3-month price action chart of HSBC: price, SMA20/50, Bollinger, support & resistance. Data: exchange via Yahoo Finance.
Oscillators & Momentum
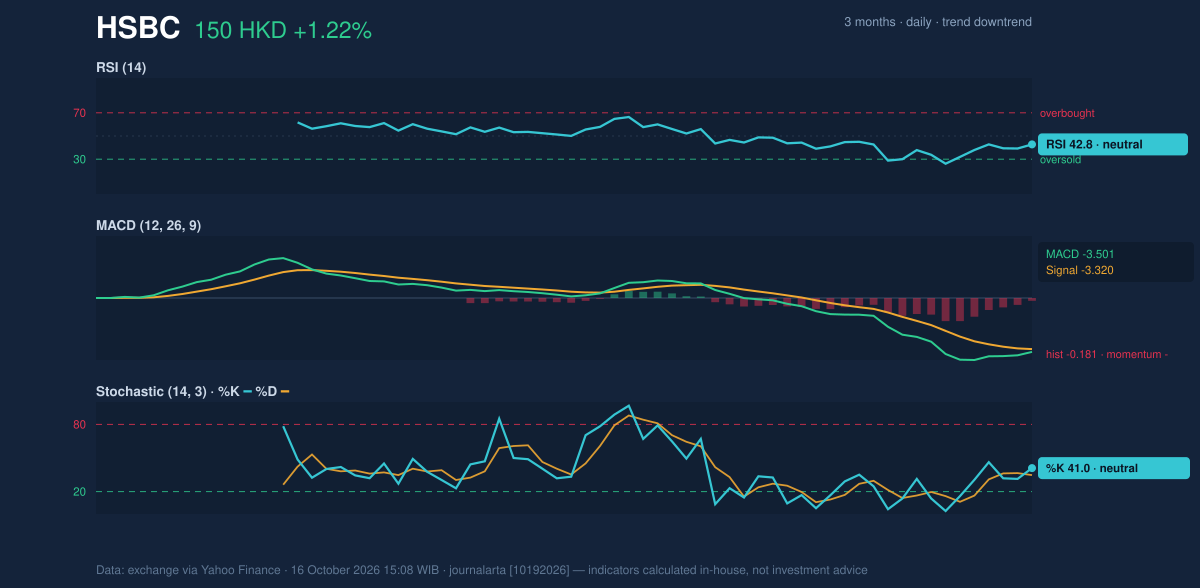
The momentum readings are mixed rather than strongly bearish or bullish. The RSI is 42.8, in neutral territory; the Relative Strength Index gauges the pace of recent gains and losses, and this reading does not indicate an extreme condition. The Stochastic readings are also neutral, with %K at 41.0 and %D at 34.8. The pair’s position is consistent with a modest recovery, but does not establish that buyers have taken control.
The MACD offers the clearest caution. Its reading of -3.501 is below the signal line at -3.320, while the histogram is -0.181. MACD compares two moving averages to assess momentum; a negative histogram means the faster measure remains weaker than its signal line. That negative MACD configuration leaves the short-term rebound without momentum confirmation.
As shown in the chart, the neutral RSI and Stochastic readings contrast with a still-negative MACD.
Momentum chart of HSBC: RSI(14), MACD, Stochastic. Data: exchange via Yahoo Finance.
Volatility, Volume & Key Levels
The Bollinger Band width is 14.9%, described as normal rather than unusually tight or expanded. That gives no clear squeeze signal—a period of unusually narrow bands that can precede a larger move. Average True Range (ATR), a measure of typical price movement, is HK$3.70, or 2.5% of the share price, indicating moderate volatility rather than unusually wide daily swings.
Volume was 12,339,898 shares, close to the 20-day average of 11,915,355, or 1.0 times normal. On-balance volume (OBV), which accumulates volume on rising sessions and subtracts it on falling sessions, is rising. That provides evidence of buying participation, but the near-average turnover and negative MACD make it insufficient on its own to confirm a reversal.
The immediate test is whether price can regain the HK$153.33 20-day average; above it, the HK$158.86 50-day average and HK$161.60 range resistance are the next reference levels. Failure to hold near-term support at HK$142.60 would weaken the recovery case, with the three-month low at HK$142.00 and lower Bollinger Band at HK$141.93 nearby.
Technical Verdict: HOLD (wait & see)
HOLD (wait & see) fits the conflicting evidence: the price remains below both falling moving averages, MACD momentum is negative, and neutral oscillators have not confirmed a reversal. Rising OBV and the recent five-day gain offer a counter-signal, but neither is yet matched by stronger price structure.
The verdict is invalidated if the price falls below HK$142.60 support.
- Ideal entry range: HK$142.60–HK$153.33, between near-term support and the 20-day average; the setup remains conditional on price holding support.
- Exit target: HK$158.86–HK$161.60, defined by the 50-day average and 20-day resistance.
- Stop-loss protection: Below HK$141.93, the lower Bollinger Band and just beneath the three-month low of HK$142.00.
In plain English, the chart shows a bounce, but not yet enough evidence that HSBC’s broader downtrend has turned.
Data: HKEX-listed 0005.HK, via Yahoo Finance, as of 16 October 2026, 15:08 WIB.
Summary Data HSBC
Last price
149.70 HKD
Change 1 day / 5 days / 1 month
1.22% / 3.10% / -6.32%
Trend / MA-cross
downtrend / none
SMA20 / SMA50
153.33 / 158.86
RSI (14) / Stochastic %K
42.8 / 41.0
Bollinger %B / ATR
34% / 3.70
Support / Resistance 20 days
142.60 / 161.60
Data as of
16 October 2026 15:08 WIB
Disclaimer: This technical analysis is generated automatically from exchange data (via Yahoo Finance) and indicators calculated by JournalArta, for information and education only. The verdict and the entry, target and stop-loss levels are not investment advice or a solicitation to buy or sell any security. Investment decisions and their risks rest solely with the reader.