GOOGL Stock Technicals: Gains 1.05% on Monday, Golden Cross Formed
On October 19, 2026: price 344.18 USD, trend sideways, RSI 48.1, support 337.83, resistance 353.78. technical analysis of googl stock. GOOGL Stock Technicals —…
Why GOOGL is in focus today
- Fresh golden cross: SMA20 crossed above SMA50
Selected automatically from 32 NASDAQ (US) stocks by a technical-signal score with daily weighted randomisation — not a recommendation.
Trend & Price Action
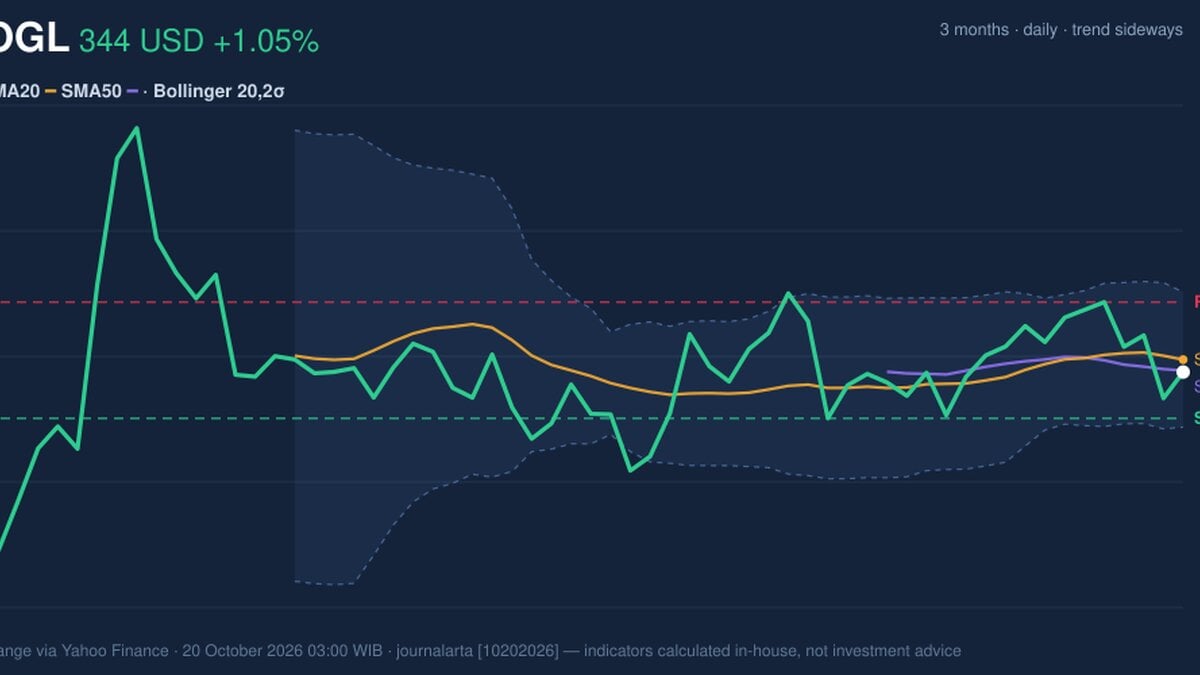
The newly formed golden cross—when the 20-day moving average moves above the 50-day average—suggests the shorter-term trend has improved relative to the longer one. Yet the gap is narrow: the SMA20 stands at $345.87, while the SMA50 is $344.38. Alphabet is below both, and the 20-day average has edged down 0.06% over five days. That makes the cross a tentative positive signal, not confirmation of a sustained climb. The share price is also caught between recent support at $337.83 and resistance at $353.78, sitting about 40% of the way through that range. Its one-day gain has not erased declines of 2.42% over five days and 3.04% over a month. The three-month high and low, $384.48 and $314.90, show how far the broader trading range extends. The golden cross is constructive, but price has yet to reclaim either key moving average. As shown in the chart, the price remains near the middle of its Bollinger range: the bands run from $336.61 to $355.14, with the middle line at $345.87. The 41% %B reading places the shares below that midpoint. The bands have narrowed to 5.4%, a squeeze that signals compressed price movement and the potential for a sharper move, but not its direction.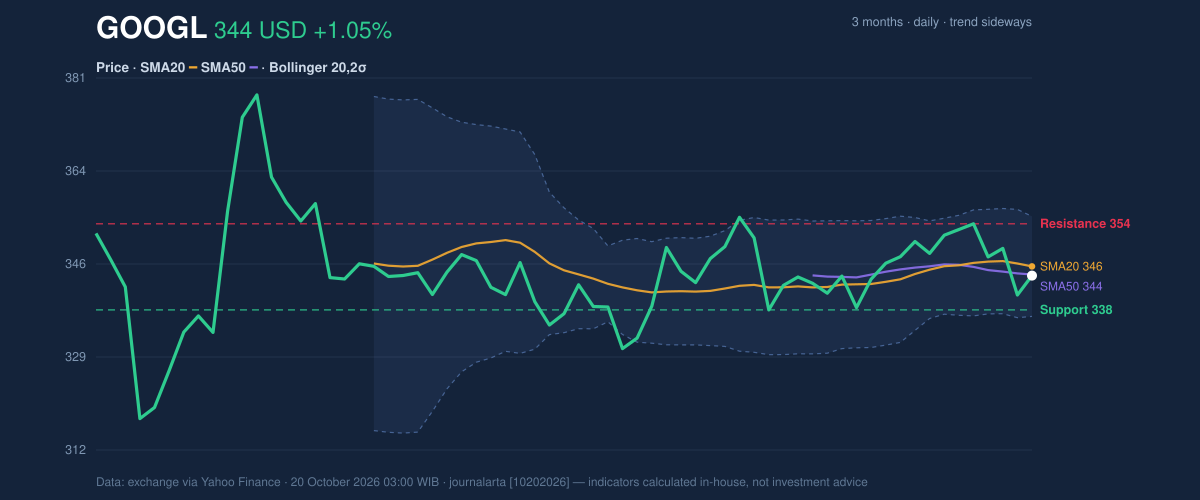
Oscillators & Momentum
Momentum indicators do not yet confirm a bullish turn. The RSI, a measure of the pace of recent gains and losses, is 48.1—neutral rather than stretched in either direction. Stochastic readings are also neutral, with %K at 36.3 and %D at 38.3. Their proximity suggests little evidence of a decisive short-term shift. MACD momentum is negative: its reading of 0.733 is below the 1.145 signal line, leaving a histogram of -0.412. In plain terms, the underlying trend measure remains positive, but its recent momentum is weaker than the signal used to gauge it. That tension matters: the golden cross points to improving trend structure, while MACD says buying pressure has not yet taken hold.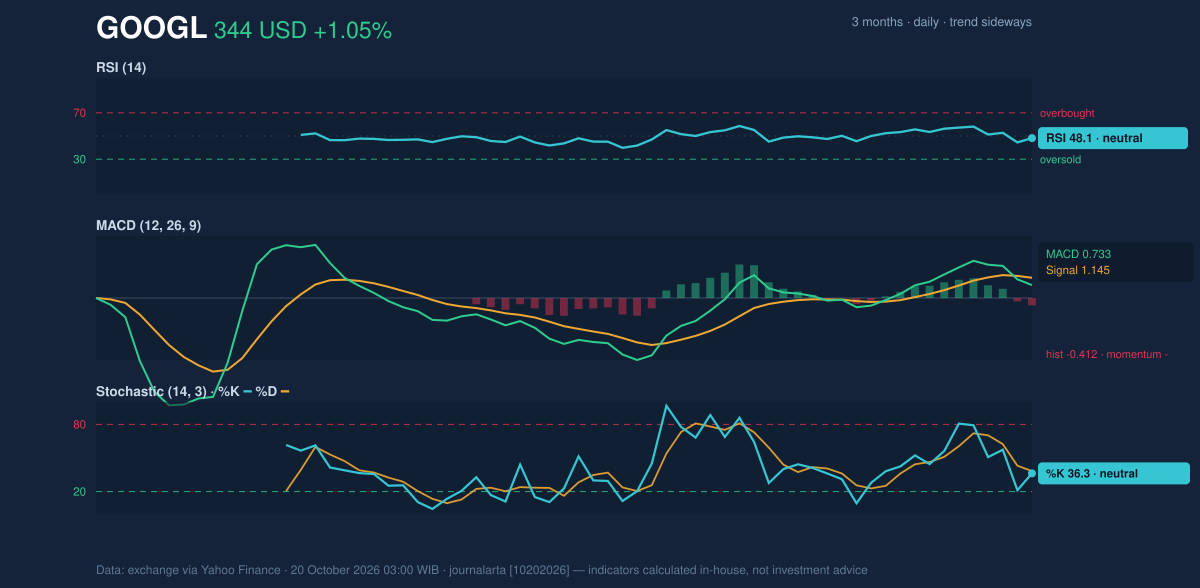
Volatility & Volume
The average true range, a gauge of typical daily movement, is $9.04, or 2.6% of the share price. That indicates moderate volatility, while the narrowing Bollinger bands suggest recent swings have become more contained. A break from that compression could bring a larger move, but the indicators provide no reliable direction on their own. Trading volume was 19,793,800 shares, about 0.8 times the 20-day average of 24,597,000. The lighter participation means the latest gain carries less confirmation from trading activity. On the other hand, on-balance volume, which tracks whether volume is associated with buying or selling days, is rising. That offers a counterpoint: accumulated volume is improving even as the latest session was quieter than normal.Key Levels & Scenarios
Support is $337.83; resistance is $353.78. A move above resistance would put the price beyond the recent range ceiling and could strengthen the case that the squeeze is resolving upward. A failure to hold support would weaken the golden-cross signal and raise the risk that the shares revisit lower parts of their three-month range. Between those levels, the mixed moving-average and momentum readings leave the price without a clear directional confirmation.Technical Verdict: HOLD (wait & see)
The indicators support a neutral verdict: the golden cross and rising OBV are positive, but the price remains below both moving averages, MACD momentum is negative, and below-average volume limits confirmation. - Ideal entry range: $337.83–$345.87, framed by 20-day support and the SMA20. - Exit target: $353.78, the 20-day resistance level. - Stop-loss protection: Below $336.61, the lower Bollinger band; the verdict is invalidated if the price breaks below $337.83. For non-traders, the signals are not aligned enough to show whether Alphabet’s next meaningful move will be up or down.Data
Market data: exchange figures via Yahoo Finance, as of 20 October 2026, 03:00 WIB. Last price: $344.18; previous close: $340.59; one-day change: +1.05%; five-day change: -2.42%; one-month change: -3.04%. SMA20: $345.87; SMA50: $344.38; golden cross. Bollinger bands: $355.14 upper, $345.87 middle, $336.61 lower; %B: 41%; width: 5.4%. RSI: 48.1. Stochastic: %K 36.3, %D 38.3. MACD: 0.733; signal: 1.145; histogram: -0.412. ATR: $9.04. Volume: 19,793,800; 20-day average: 24,597,000; OBV: rising. Support: $337.83; resistance: $353.78. Three-month high/low: $384.48/$314.90.Summary Data GOOGL
| Last price | 344.18 USD |
| Change 1 day / 5 days / 1 month | 1.05% / -2.42% / -3.04% |
| Trend / MA-cross | sideways / golden |
| SMA20 / SMA50 | 345.87 / 344.38 |
| RSI (14) / Stochastic %K | 48.1 / 36.3 |
| Bollinger %B / ATR | 41% / 9.04 |
| Support / Resistance 20 days | 337.83 / 353.78 |
| Data as of | 20 October 2026 03:00 WIB |
Disclaimer: This technical analysis is generated automatically from exchange data (via Yahoo Finance) and indicators calculated by JournalArta, for information and education only. The verdict and the entry, target and stop-loss levels are not investment advice or a solicitation to buy or sell any security. Investment decisions and their risks rest solely with the reader.
Track GOOGL stock price daily: live levels, support/resistance and our full GOOGL analysis history.