RELX Stock Technicals: Gains 0.79% on Monday, RSI Overbought
On October 19, 2026: price 2,937.00 GBp, trend uptrend, RSI 79.0, support 2,450.00, resistance 2,937.00. technical analysis of relx stock.
Why RELX is in focus today
- Closed at a 20-day high (2,937.00)
- Trading near its 3-month high (2,958.00)
- Fresh golden cross: SMA20 crossed above SMA50
- RSI(14) at 79.0 — overbought zone
- Uptrend confirmed (5-day change 6.41%)
Selected automatically from 16 LSE (UK) stocks by a technical-signal score with daily weighted randomisation — not a recommendation.
Trend & Price Action
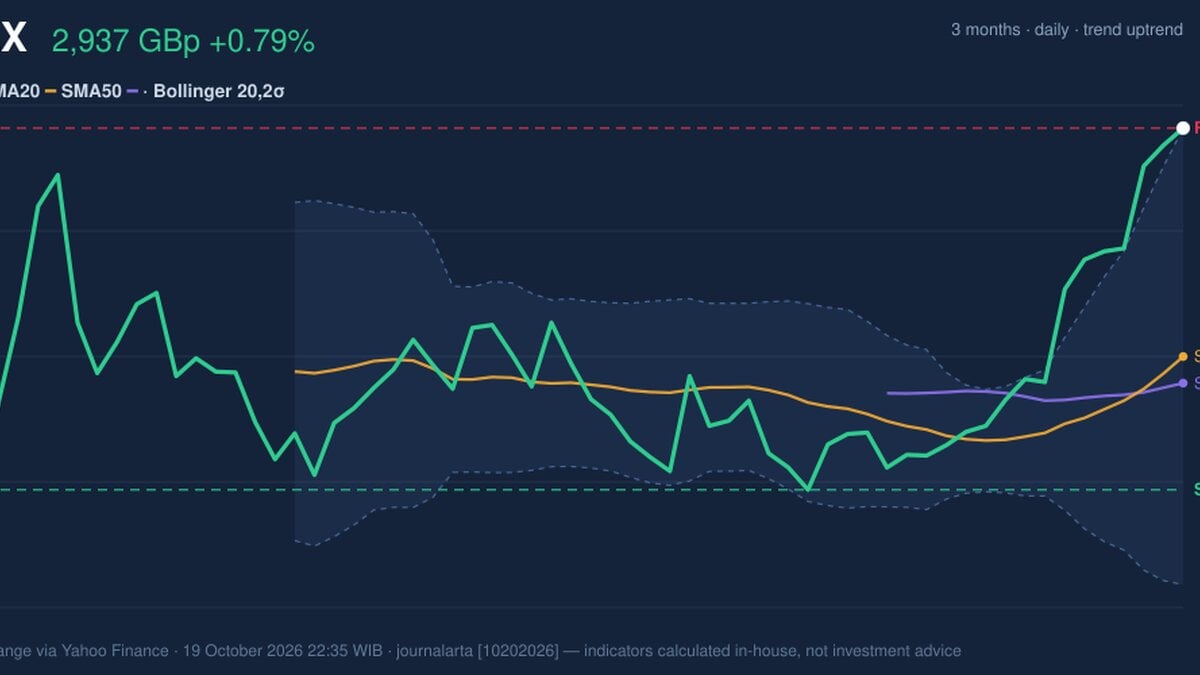
RELX is trading well above its 20-day simple moving average (SMA), at 2,629.40 GBp, and its 50-day SMA, at 2,593.64 GBp. The 20-day average has risen 3.25% over five days, while its move above the 50-day average forms a golden cross, a signal of improving short-term trend strength. The averages are close together, but the share’s distance above both shows that the rally has accelerated beyond its recent average. The close at 2,937.00 GBp, the 20-day resistance level, places the price at the top of its recent range. It is also near the three-month high of 2,958.00 GBp. That position marks strength, but leaves little room before the next recorded high: a move above it would extend the advance, while a failure to hold near current levels could bring the gap to the moving averages into focus. As shown in the chart, the price is pressing the upper Bollinger Band, with the middle and lower bands providing context for the sharp separation between the current price and recent trading levels.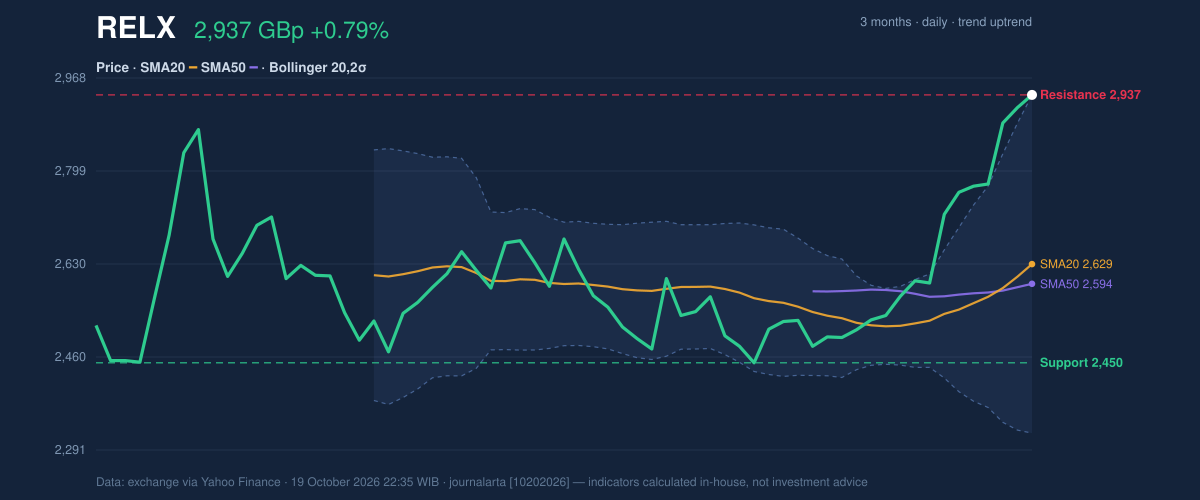
Oscillators & Momentum
Momentum indicators confirm the rise, though they also warn that the move is crowded. The RSI is 79.0, in overbought territory; the Relative Strength Index measures the speed and scale of recent price changes, and a high reading signals strong buying momentum that may be vulnerable to pauses. The Stochastic readings—%K 99.3 and %D 95.7—are also overbought, showing that the price is near the top of its recent range. Those readings are not, by themselves, evidence that a reversal has begun. The MACD remains positive at 88.936, above its 46.805 signal line, with a 42.131 histogram. The MACD compares moving averages to track trend momentum; its positive configuration indicates the advance remains active. As shown in the chart, the tension is between that positive trend signal and the overbought readings.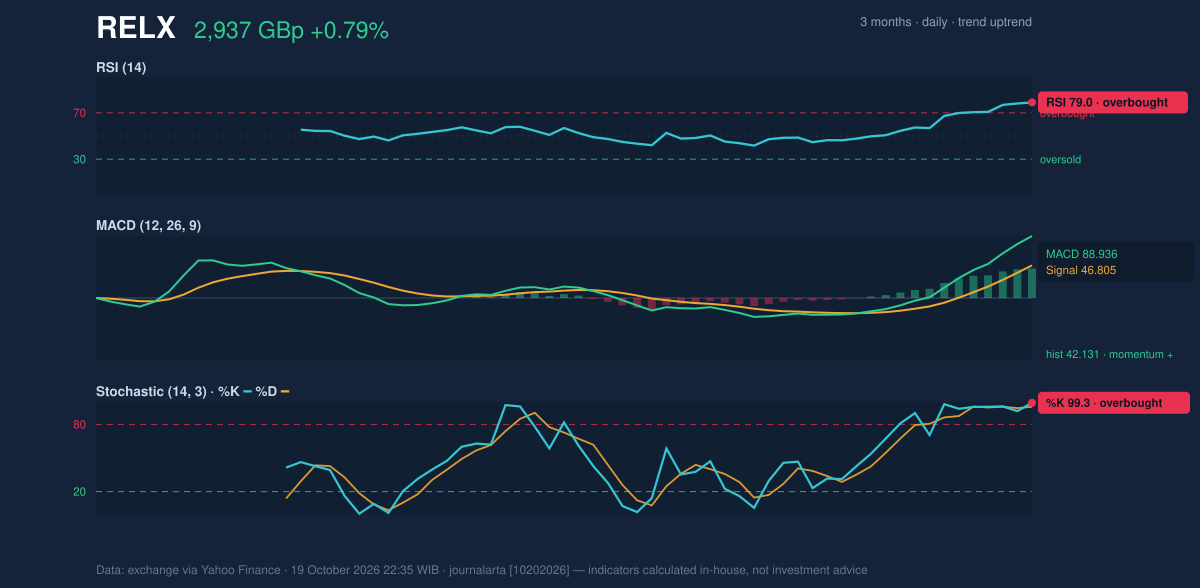
Volatility & Volume
The price has reached the upper Bollinger Band at 2,936.64 GBp, putting %B at 100%. Bollinger Bands widen as price fluctuations grow; here, the 23.4% band width is widening, which points to elevated volatility rather than a settled, low-risk climb. The average true range (ATR), a measure of typical price movement, is 283.72 GBp, or 9.7% of the share price. That is a substantial range relative to the latest close and means price swings can be large. The volume reading is a major caveat: the latest reported volume is just 3 shares against a 20-day average of 3,890,964, effectively no participation in the session’s move. The data also show On-Balance Volume (OBV), a running measure that relates volume to price direction, rising. But that broader signal does not remove the problem of the latest session’s thin volume, which weakens confirmation of the close at resistance.Technical Verdict: HOLD
The technical balance supports HOLD (wait & see): the golden cross, rising short-term average and positive MACD favour the trend, but RSI and Stochastic are overbought, price is at resistance, volatility is high and the latest volume is exceptionally thin. The verdict is invalidated if the price falls below 2,450.00 GBp, the recorded 20-day support. - Ideal Entry Range: 2,629.40–2,937.00 GBp, spanning the 20-day SMA to resistance; the upper end is resistance, not confirmation of a breakout. - Exit Target: 2,958.00 GBp, the recorded three-month high. - Stop Loss: 2,450.00 GBp, the recorded 20-day support. For non-traders, the indicators show a rising trend, but the price is stretched and needs stronger trading activity to confirm its push beyond resistance.Summary Data RELX
| Last price | 2,937.00 GBp |
| Change 1 day / 5 days / 1 month | 0.79% / 6.41% / 18.43% |
| Trend / MA-cross | uptrend / golden |
| SMA20 / SMA50 | 2,629.40 / 2,593.64 |
| RSI (14) / Stochastic %K | 79.0 / 99.3 |
| Bollinger %B / ATR | 100% / 283.72 |
| Support / Resistance 20 days | 2,450.00 / 2,937.00 |
| Data as of | 19 October 2026 22:35 WIB |
Disclaimer: This technical analysis is generated automatically from exchange data (via Yahoo Finance) and indicators calculated by JournalArta, for information and education only. The verdict and the entry, target and stop-loss levels are not investment advice or a solicitation to buy or sell any security. Investment decisions and their risks rest solely with the reader.
Track RELX share price daily: live levels, support/resistance and our full RELX analysis history.