Rolls-Royce Stock Analysis: Drops 1.41%, Testing Support Level
On October 19, 2026: price 1,331.60 GBp, trend downtrend, RSI 33.0, support 1,331.60, resistance 1,503.20. technical analysis of rolls-royce stock.
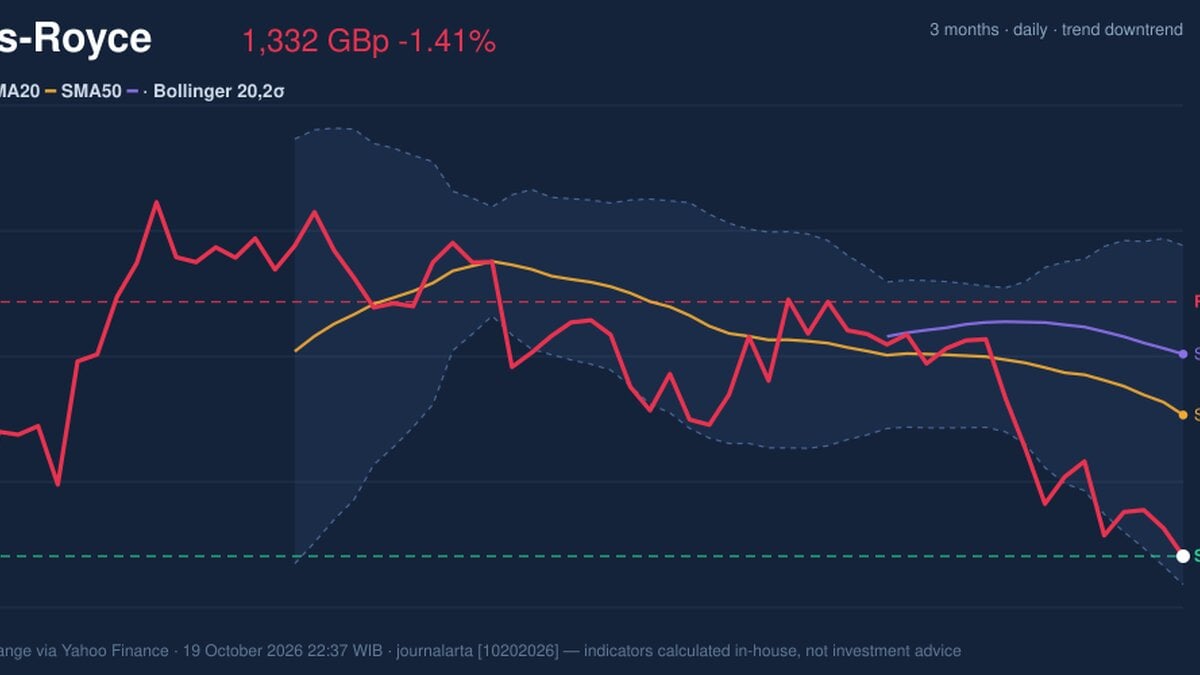
Rolls-Royce closed at 1,331.60 GBp on 19 October, down 1.41% on the day and 4.59% over five trading days, finishing at its stated 20-day low. The move extends a broader decline: the shares are 11.51% lower over one month, while the short-term moving average is falling. That combination makes the level important—not as proof of a rebound, but as a test of whether selling pressure can push the price below its current support.
Why Rolls-Royce is in focus today
- Closed at a 20-day low (1,331.60)
- Downtrend extending (5-day change -4.59%)
Selected automatically from 16 LSE (UK) stocks by a technical-signal score with daily weighted randomisation — not a recommendation.
Trend & Price Action
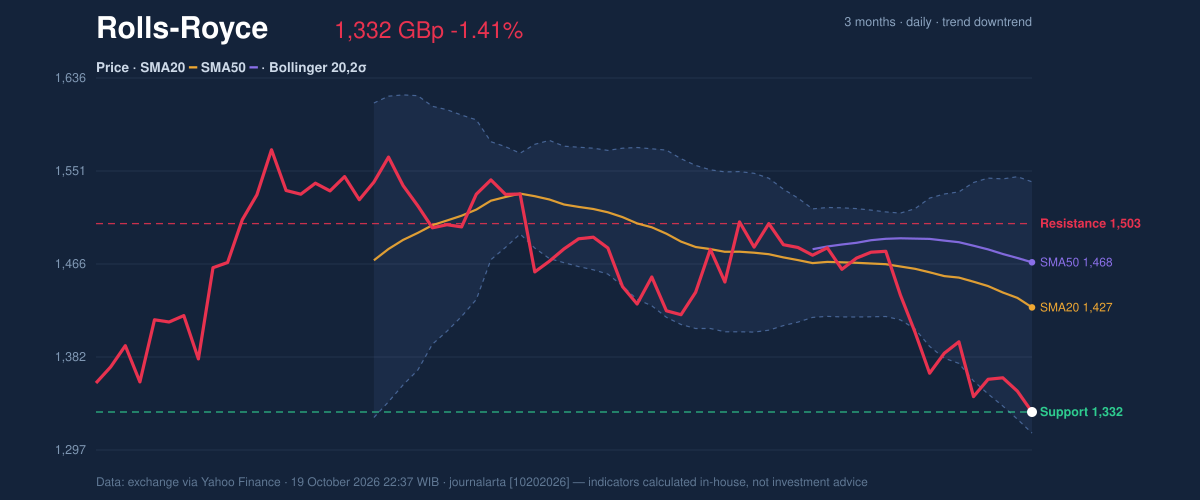
The share price sits below both its 20-day simple moving average (SMA20) at 1,426.85 and its 50-day average at 1,467.94. The SMA20 has fallen 1.87% over five days, reinforcing the downtrend. There has been no new moving-average crossover, so the averages do not provide a fresh reversal signal. Instead, their position shows that the recent price weakness is persistent: the stock would need to recover above the shorter average before the immediate trend picture improves.
The price is at the bottom of its stated 20-day range, with support at 1,331.60 and resistance at 1,503.20. As shown in the chart, the price is also close to the lower Bollinger Band at 1,312.41, while the band’s midpoint is 1,426.85. Bollinger Bands track how far prices are moving around an average; a reading near the lower band signals weakness, but does not by itself confirm that a rebound is due. The 16.0% band width is described as normal, rather than a squeeze that might precede a sharp expansion in volatility.
The immediate technical test is whether support at 1,331.60 holds.
Oscillators & Momentum
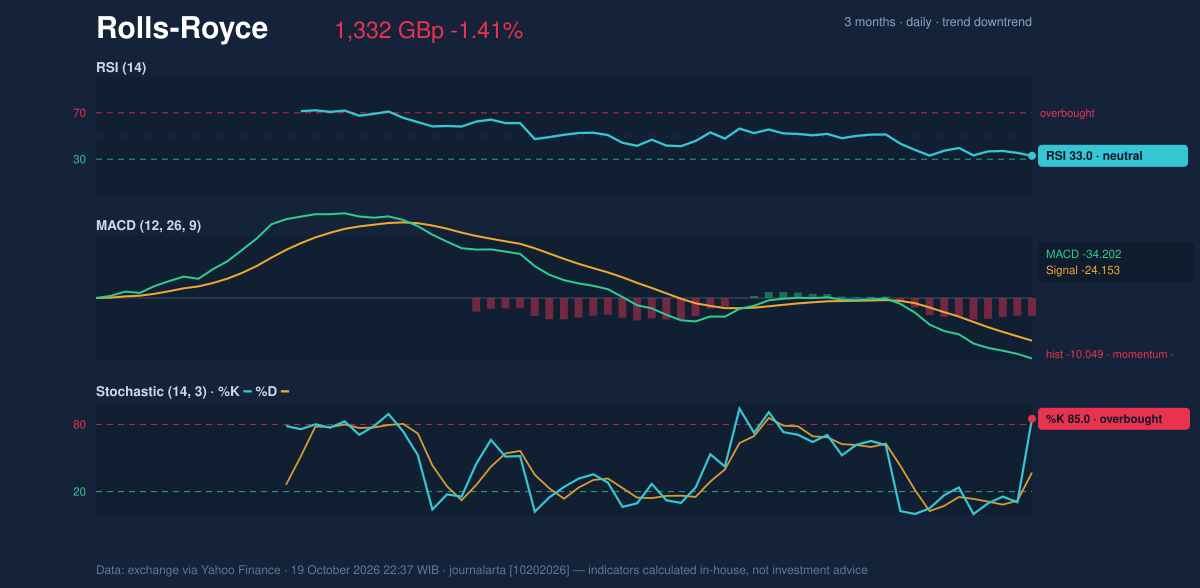
Momentum indicators are mixed, but the more directional measure remains negative. The RSI is 33.0, labelled neutral in the supplied data. It is near the lower end of its scale, but does not establish that the decline has exhausted itself. The Stochastic reading is more conflicted: %K at 85.0 is marked overbought, while %D is 37.0. That split makes the signal difficult to treat as a clean turning point.
MACD remains negative at -34.202, below its -24.153 signal line, with a -10.049 histogram. The MACD compares short- and longer-term price momentum; a negative reading below the signal line indicates that downside momentum is still in control. As shown in the chart, this bearish MACD picture contrasts with the elevated Stochastic %K, a divergence that calls for caution rather than a confident reversal reading.
Volatility, Volume & Key Levels
Average True Range (ATR) is 144.73, or 10.9% of the last price, indicating high volatility. ATR estimates typical price movement, not its direction; here, it means the support test could be accompanied by large swings. The latest reported volume is 275 against a 20-day average of 17,300,456, classified as thin. That makes the session’s price move harder to interpret as a strong volume-confirmed signal. On the other hand, OBV, a measure that relates volume to whether prices rise or fall, is rising. This is a counter-signal, but thin reported volume limits how much confirmation it offers.
Support is 1,331.60; resistance is 1,503.20. A sustained break below support would weaken the chart further and invalidate a wait-and-see reading. If support holds, the lower Bollinger Band at 1,312.41 is a nearby reference, while a recovery would first encounter the SMA20 at 1,426.85 and then resistance. The stated three-month high is 1,586.00; the supplied low is 0.00, so that low does not provide a useful trading reference.
Technical Verdict: HOLD (wait & see)
HOLD (wait & see) best reflects the conflicting evidence: the price is at 20-day support and near the lower Bollinger Band, but the falling SMA20 and negative MACD show that the downtrend remains intact. RSI at 33.0 is not marked oversold, while the elevated Stochastic %K does not align cleanly with the bearish MACD. The verdict is invalidated if the price breaks below 1,331.60.
- Ideal entry range: 1,312.41–1,331.60, defined by the lower Bollinger Band and 20-day support.
- Exit target: 1,426.85–1,503.20, spanning the SMA20 to 20-day resistance.
- Stop-loss protection: Below 1,312.41, the lower Bollinger Band.
For non-traders, this is a chart still under pressure, with support needing to hold before the evidence improves.
Data Table
| Indicator | Reading |
|---|---|
| Last price | 1,331.60 GBp |
| Daily / five-day / one-month change | -1.41% / -4.59% / -11.51% |
| SMA20 / SMA50 | 1,426.85 / 1,467.94 |
| Bollinger Bands (upper / middle / lower) | 1,541.29 / 1,426.85 / 1,312.41 |
| RSI / Stochastic %K and %D | 33.0 / 85.0 and 37.0 |
| MACD / signal / histogram | -34.202 / -24.153 / -10.049 |
| ATR | 144.73 (10.9% of price) |
| 20-day support / resistance | 1,331.60 / 1,503.20 |
Summary Data Rolls-Royce
| Last price | 1,331.60 GBp |
| Change 1 day / 5 days / 1 month | -1.41% / -4.59% / -11.51% |
| Trend / MA-cross | downtrend / none |
| SMA20 / SMA50 | 1,426.85 / 1,467.94 |
| RSI (14) / Stochastic %K | 33.0 / 85.0 |
| Bollinger %B / ATR | 8% / 144.73 |
| Support / Resistance 20 days | 1,331.60 / 1,503.20 |
| Data as of | 19 October 2026 22:37 WIB |
Disclaimer: This technical analysis is generated automatically from exchange data (via Yahoo Finance) and indicators calculated by JournalArta, for information and education only. The verdict and the entry, target and stop-loss levels are not investment advice or a solicitation to buy or sell any security. Investment decisions and their risks rest solely with the reader.
Track Rolls-Royce share price daily: live levels, support/resistance and our full Rolls-Royce analysis history.