Rio Tinto Testing Support Level: Stock Drops 1.48% (October 19, 2026)
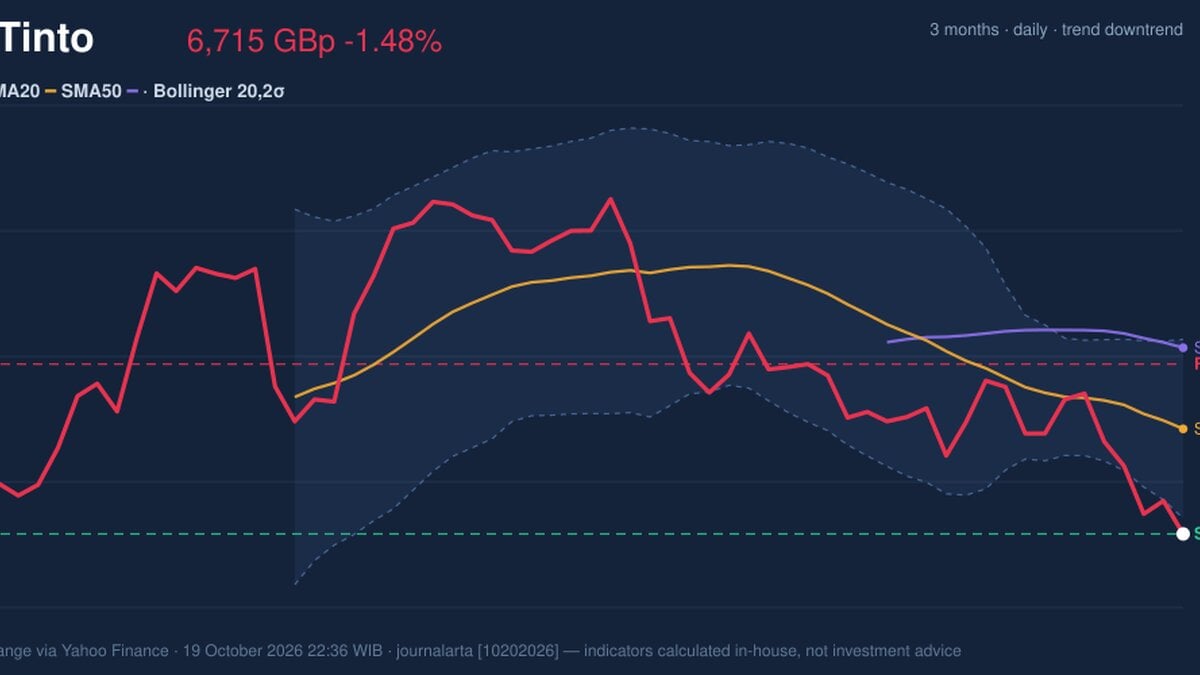
On October 19, 2026: price 6,715.00 GBp, trend downtrend, RSI 32.7, support 6,715.00, resistance 7,234.00. technical analysis of rio tinto stock.
Why Rio Tinto is in focus today
- Closed at a 20-day low (6,715.00)
- Breaking out of a Bollinger squeeze (band width 7.8%)
- Downtrend extending (5-day change -6.01%)
Selected automatically from 16 LSE (UK) stocks by a technical-signal score with daily weighted randomisation — not a recommendation.
Trend & Price Action
The shares finished at the stated 20-trading-day support of 6,715.00 GBp, placing them at the bottom of the reported 20-day range. That is a fragile position: support is a level where buyers have previously appeared, but a close at that boundary does not confirm that they will do so again. The reported three-month low is 0.00, which is not useful as a practical price reference; the 20-day levels provide the clearer guide in this data set. As shown in the chart, price sits below the falling SMA20 and below the SMA50, while the latest close is also beneath the lower Bollinger Band at 6,762.44 GBp.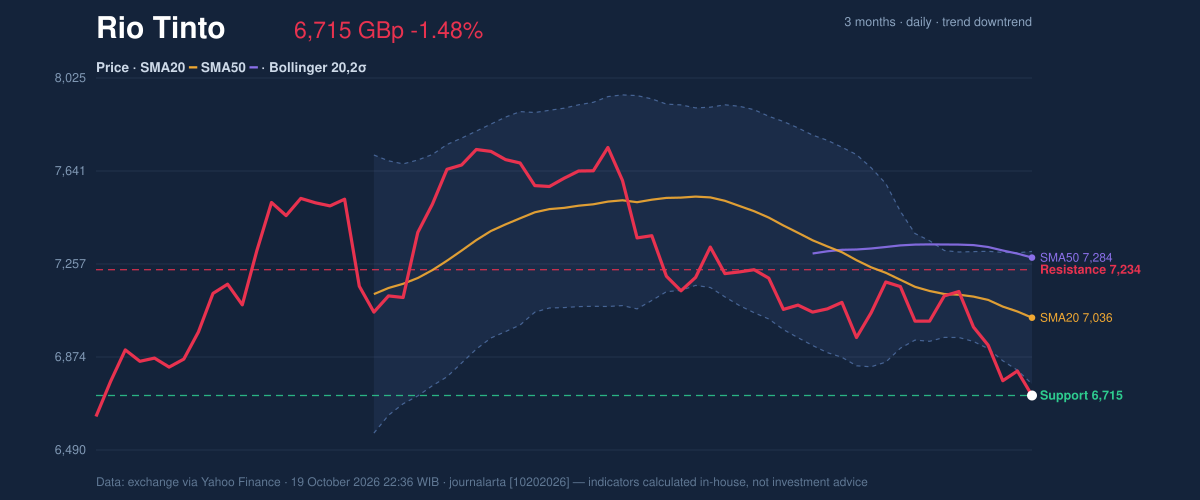
Oscillators & Momentum
Momentum measures broadly reinforce the weak price structure, though the indicators are not giving identical messages. The RSI, or Relative Strength Index, is 32.7—often read as approaching oversold territory, but classified as neutral in the supplied data. It suggests selling pressure has been substantial, yet it does not by itself establish that the decline is exhausted. MACD is negative at -120.648, below its -91.129 signal line, with a negative histogram of -29.519. MACD compares shorter- and longer-term price momentum; readings below the signal line indicate that downward momentum is still dominant. By contrast, the Stochastic readings—%K at 85.3 and %D at 40.9—are flagged as overbought. This oscillator tracks where the close sits within a recent price range, so the elevated %K may reflect a short-term bounce or abrupt fluctuations rather than a reversal in the broader trend. The indicators, therefore, do not yet align behind a durable recovery. The RSI is subdued, while MACD remains negative and the Stochastic is elevated.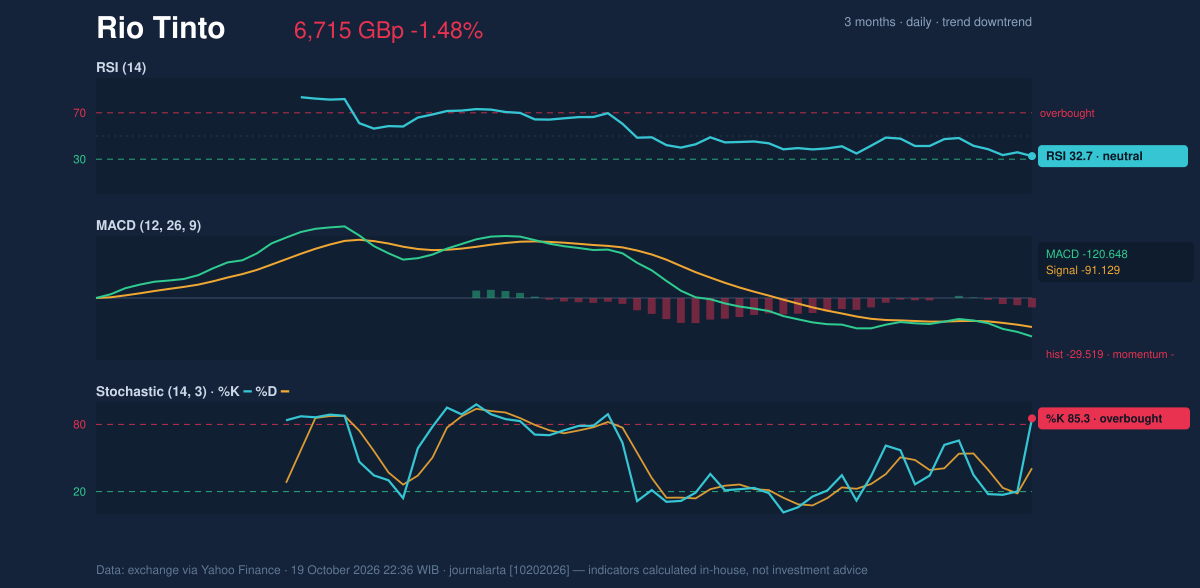
Volatility & Volume
The 14-day Average True Range (ATR), a measure of typical price movement, stands at 724.25 GBp, equivalent to 10.8% of the share price. That is high volatility: moves around technical levels may be sharp, and a break could travel quickly in either direction. The narrowing band followed by a move below its lower edge adds to the case for heightened movement, but not for a predetermined outcome. Participation data offer little confirmation. Reported volume was 22 against a 20-day average of 2,116,904, classed as thin, while On-Balance Volume (OBV)—a measure that accumulates volume according to price direction—was falling. With activity so far below its stated average, the close’s significance is harder to assess; falling OBV nevertheless aligns with the prevailing selling pressure.Key Levels & Scenarios
The immediate reference is support at 6,715.00 GBp, while the reported 20-day resistance is 7,234.00 GBp. A sustained move back above support, followed by a recovery through the lower Bollinger Band at 6,762.44 GBp, would ease immediate downside pressure. A move toward resistance would be a more meaningful test of whether buyers can challenge the falling trend. If support fails, the supplied data do not provide a reliable lower level for the next destination.Technical Verdict: HOLD (wait & see)
The technical picture supports a cautious, wait-and-see verdict rather than a clear directional call. The strongest reasons are the falling trend, with price below both moving averages; negative MACD momentum; and the close at 20-day support after a break below the lower Bollinger Band. The low reported volume and conflicting oscillator signals limit confidence. This verdict is invalidated if the price falls below 6,715.00 GBp.- Ideal Entry Range: 6,715.00–6,762.44 GBp, conditional on support holding and the price recovering above the lower Bollinger Band.
- Exit Target: 7,234.00 GBp, the reported 20-day resistance.
- Stop Loss: Below 6,715.00 GBp, the stated support and invalidation level.
Summary Data Rio Tinto
| Last price | 6,715.00 GBp |
| Change 1 day / 5 days / 1 month | -1.48% / -6.01% / -7.06% |
| Trend / MA-cross | downtrend / none |
| SMA20 / SMA50 | 7,035.95 / 7,283.96 |
| RSI (14) / Stochastic %K | 32.7 / 85.3 |
| Bollinger %B / ATR | -9% / 724.25 |
| Support / Resistance 20 days | 6,715.00 / 7,234.00 |
| Data as of | 19 October 2026 22:36 WIB |
Disclaimer: This technical analysis is generated automatically from exchange data (via Yahoo Finance) and indicators calculated by JournalArta, for information and education only. The verdict and the entry, target and stop-loss levels are not investment advice or a solicitation to buy or sell any security. Investment decisions and their risks rest solely with the reader.
Track Rio Tinto share price daily: live levels, support/resistance and our full Rio Tinto analysis history.