CSCO Stock Technicals: Gains 0.52% on Wednesday, Golden Cross Formed
On October 21, 2026: price 107.26 USD, trend sideways, RSI 41.9, support 106.50, resistance 118.39. technical analysis of csco stock. CSCO Stock Technicals —…
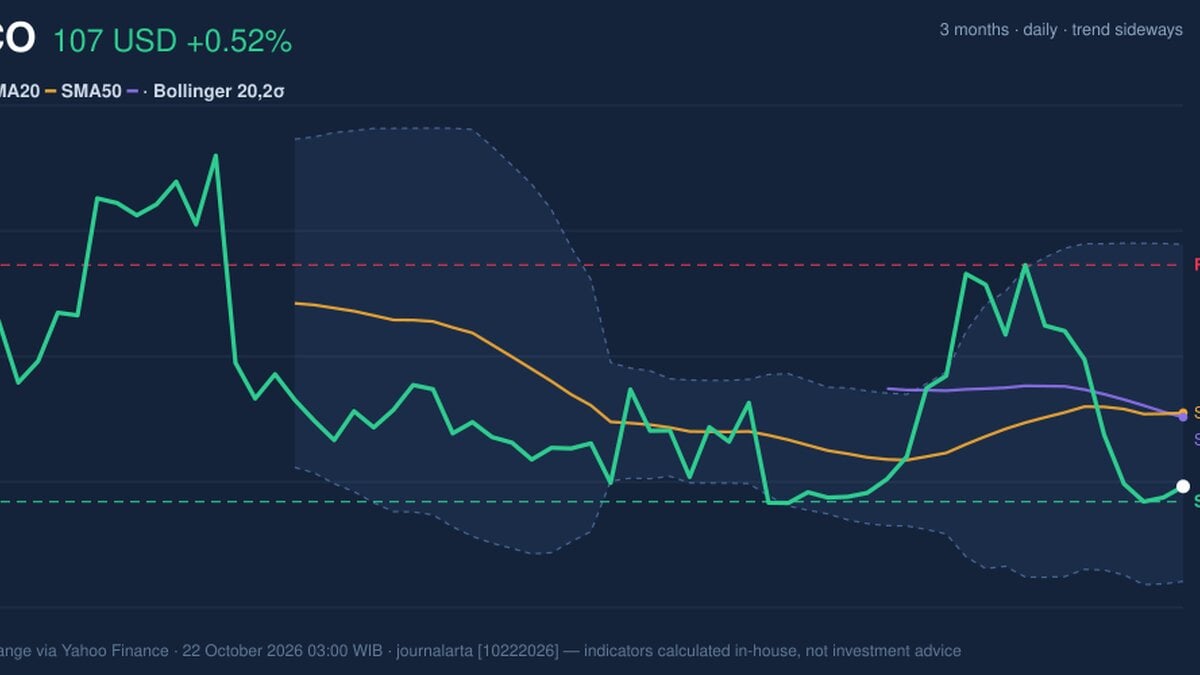
Why CSCO is in focus today
- Fresh golden cross: SMA20 crossed above SMA50
Selected automatically from 32 NASDAQ (US) stocks by a technical-signal score with daily weighted randomisation — not a recommendation.
Trend & Price Action
Cisco’s 20-day average has crossed above its 50-day average, a golden cross often read as an early sign of trend improvement. Yet the stock trades at $107.26, below the SMA20 at $110.96 and the SMA50 at $110.74. The short-term average is also sloping down by 0.29% over five days, leaving the broader pattern sideways rather than decisively bullish. That distinction matters: a crossover describes the relationship between averages, not a guarantee that price is rising. Cisco’s five-day decline of 5.61% has pulled shares toward the lower end of their recent range. The price is about 6% of the way from the 20-day support at $106.50 toward resistance at $118.39; its three-month low is $104.51, while the high is $124.71.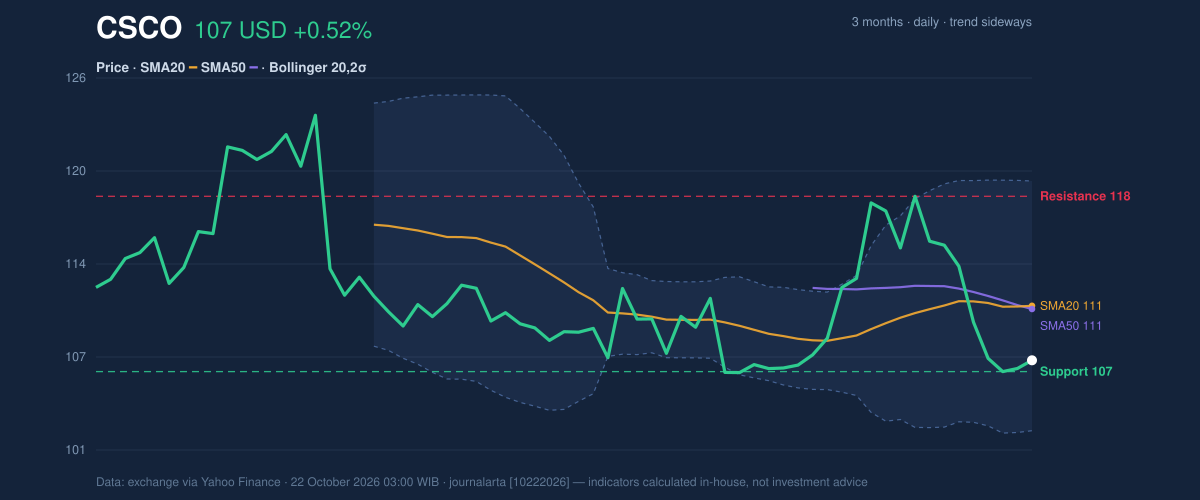
Oscillators & Momentum
Momentum indicators show weakness beneath the crossover. The RSI is 41.9, a neutral reading, suggesting the recent decline has not pushed the stock into the standard oversold zone on that measure. The Stochastic is oversold, with %K at 14.7 and %D at 8.7; that can signal a market stretched by recent selling, but it does not by itself establish that a rebound has begun. The MACD, a trend-momentum measure comparing moving averages, is negative: MACD is -0.615, below its 0.225 signal line, with a -0.840 histogram. The negative histogram indicates that downside momentum remains dominant in this comparison. In other words, the oversold Stochastic hints that selling may be extended, while MACD says the prevailing momentum has not yet turned upward.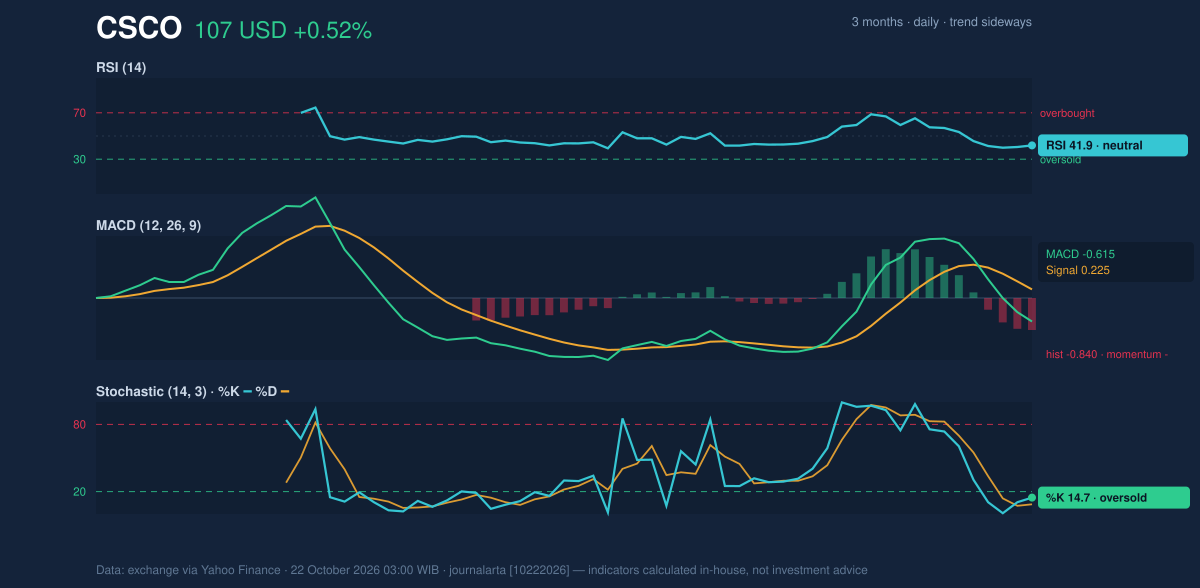
Volatility, Volume & Key Levels
Cisco’s average true range is $3.06, or 2.9% of the share price, indicating moderate day-to-day movement in this dataset. That makes the $106.50 support especially relevant: a sustained hold there would keep the price above the three-month low, while a break below it would expose the lower Bollinger boundary at $102.49. A recovery above the moving-average area around $110.74–$110.96 would be an initial sign that price is beginning to validate the golden cross. Participation remains a concern. Latest volume was 11.37 million shares, about 0.7 times the 20-day average of 16.43 million, and on-balance volume was falling. OBV tracks whether trading volume is flowing more into or out of a stock based on the direction of price changes; its decline, alongside below-average turnover, offers little confirmation that buyers are accumulating shares. Resistance at $118.39 is the next major level in the supplied range, with the upper Bollinger Band at $119.42 nearby.Technical Verdict: HOLD (wait & see)
The verdict is supported by three conflicting signals: the golden cross improves the moving-average structure, the oversold Stochastic raises the possibility that selling is stretched, but the price remains below both averages and MACD is negative. Falling OBV and thin volume further weaken the case that a durable upward move is underway. The verdict is invalidated if price falls below $106.50, the stated 20-day support. - Ideal Entry Range: $106.50–$110.96, bounded by 20-day support and the SMA20. - Exit Target: $118.39, the stated 20-day resistance. - Stop Loss: $102.49, the lower Bollinger Band. For non-traders, the indicators show a possible early improvement in trend, but not enough confirmation to establish that the share price has recovered.Data
Market data: exchange figures via Yahoo Finance, as of Oct. 22, 2026, 03:00 WIB. Latest price: $107.26; previous close: $106.71; one-day change: +0.52%; five-day change: -5.61%; one-month change: +0.78%. SMA20: $110.96; SMA50: $110.74; Bollinger Bands: upper $119.42, middle $110.96, lower $102.49; ATR(14): $3.06; 20-day support: $106.50; 20-day resistance: $118.39.Summary Data CSCO
| Last price | 107.26 USD |
| Change 1 day / 5 days / 1 month | 0.52% / -5.61% / 0.78% |
| Trend / MA-cross | sideways / golden |
| SMA20 / SMA50 | 110.96 / 110.74 |
| RSI (14) / Stochastic %K | 41.9 / 14.7 |
| Bollinger %B / ATR | 28% / 3.06 |
| Support / Resistance 20 days | 106.50 / 118.39 |
| Data as of | 22 October 2026 03:00 WIB |
Disclaimer: This technical analysis is generated automatically from exchange data (via Yahoo Finance) and indicators calculated by JournalArta, for information and education only. The verdict and the entry, target and stop-loss levels are not investment advice or a solicitation to buy or sell any security. Investment decisions and their risks rest solely with the reader.
Track CSCO stock price daily: live levels, support/resistance and our full CSCO analysis history.