PEP Stock Analysis: Gains 0.51%, Testing Key Resistance
On October 21, 2026: price 134.70 USD, trend sideways, RSI 61.5, support 123.73, resistance 134.70. technical analysis of pep stock. PEP Stock Analysis — full…
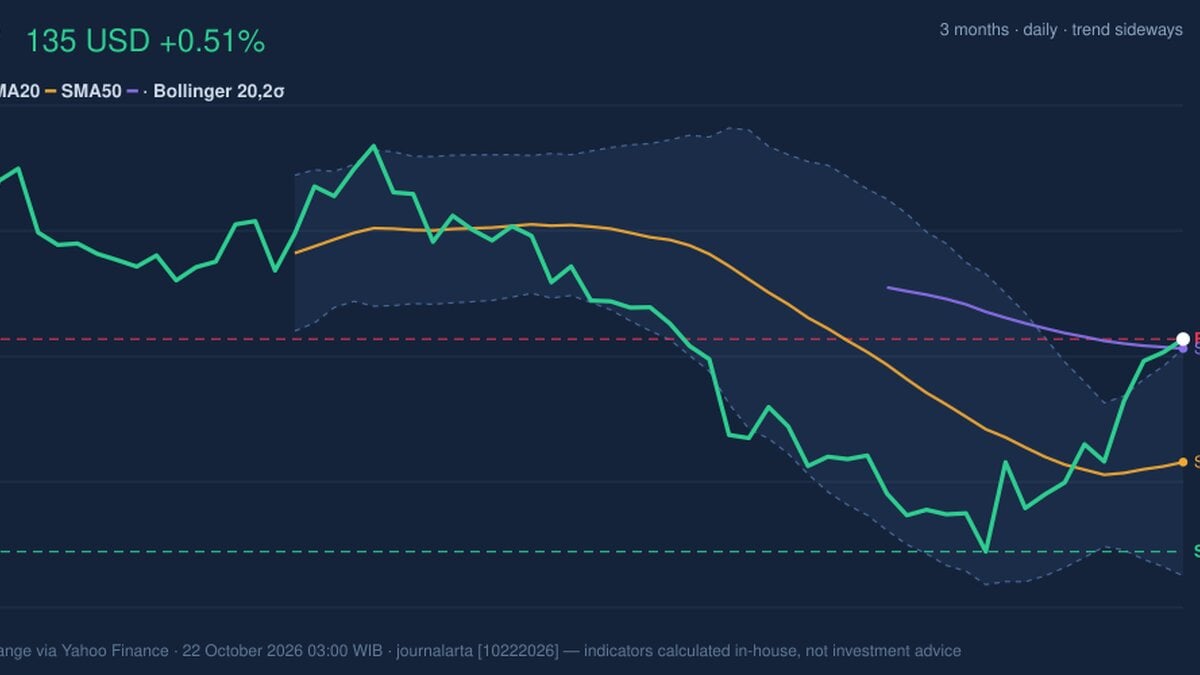
Why PEP is in focus today
- Closed at a 20-day high (134.70)
Selected automatically from 32 NASDAQ (US) stocks by a technical-signal score with daily weighted randomisation — not a recommendation.
Trend & Price Action
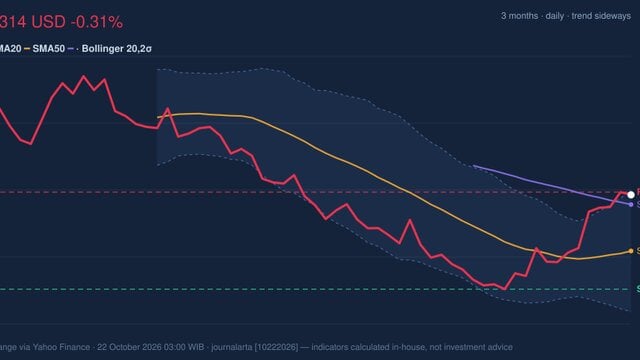
PepsiCo’s price stands above its 20-day simple moving average (SMA) of $128.35, with that average edging up 0.30% over five days. The shares are also slightly above the 50-day SMA at $134.21. There is no recent crossover between the two averages, so the data do not yet show a newly established trend signal; instead, the price is testing whether its recent recovery can hold above the longer average. The stock’s 20-trading-day resistance is $134.70, exactly its latest close, placing it at the top of that range. The three-month high is $145.90, while the three-month low is $123.47. The current price therefore marks a near-term breakout attempt, not a move through the broader three-month high. As shown in the chart, the price has climbed above the upper Bollinger Band at $134.22. The band’s width is 9.1%, described as normal rather than unusually compressed or expanded. A close beyond the upper band can reflect strong demand, but it can also mean the price has moved faster than its recent average. The key question is whether it can sustain that position.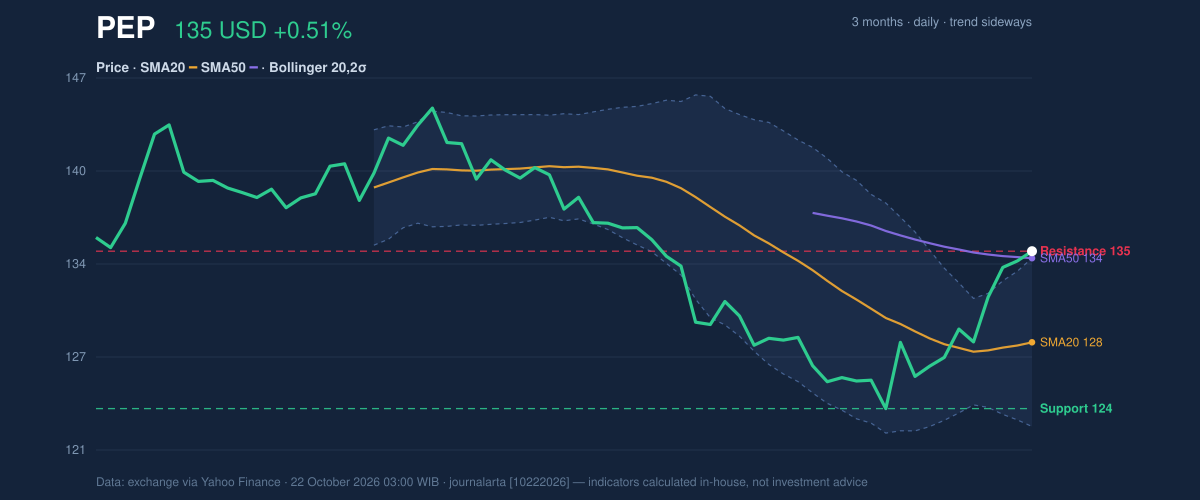
Oscillators & Momentum
Momentum is improving, but the indicators differ on how stretched the move has become. The 14-day RSI is 61.5, a neutral reading that is consistent with firmer price action without, by itself, signaling an extreme. The Stochastic readings—%K at 93.5 and %D at 94.4—are overbought. This oscillator compares a recent close with the stock’s price range; a high reading suggests the advance has been strong and may be vulnerable to a pause. MACD adds a more constructive signal. Its value is -0.113, above the signal line at -1.462, and the histogram is positive at 1.349. In plain language, the gap between the two lines has turned in a direction associated with improving momentum, even though the MACD itself remains below zero. That combination points to a recovery in momentum rather than definitive evidence of a sustained upward trend. The indicators therefore tell a two-sided story: MACD momentum is positive, while Stochastic is overbought. A pause or pullback would not automatically undo the improving momentum, but the price will need to hold above nearby averages to keep the advance intact.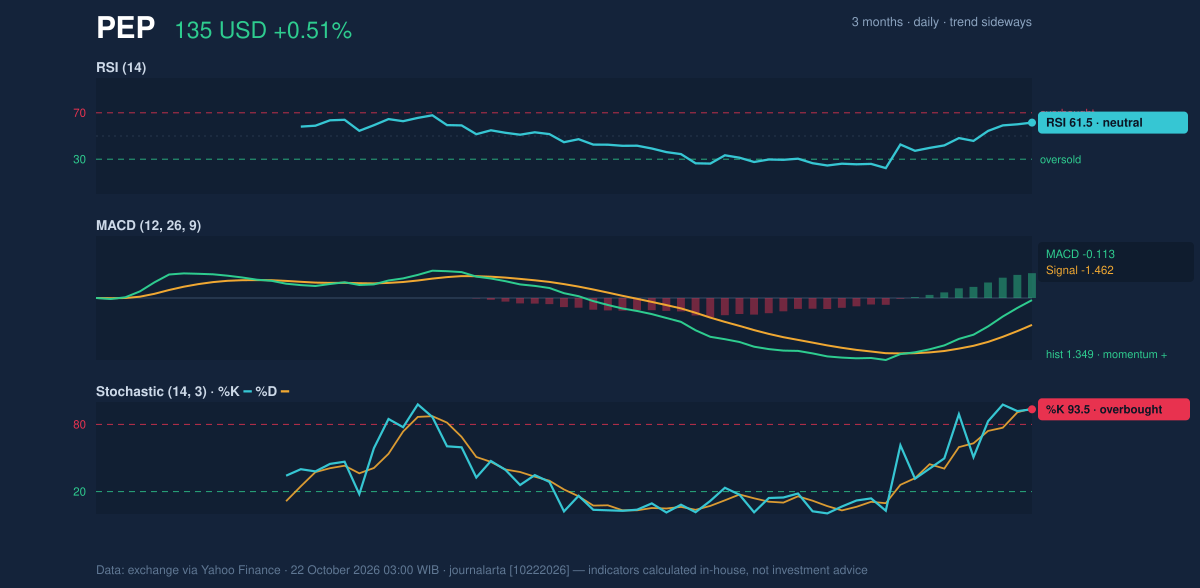
Volatility, Volume & Key Levels
Average true range (ATR), a measure of typical price movement, is $2.84, or 2.1% of the share price—moderate volatility in the supplied data. That suggests the latest move is not occurring amid exceptionally wide daily swings, even as the upper-band reading signals short-term stretch. Volume was 9.03 million shares, around 0.9 times the 20-day average of 10.15 million. On-balance volume (OBV), which tracks whether volume accompanies rising or falling prices, is rising. The combination is cautiously supportive: accumulated volume points in the same direction as price, but the latest session did not bring above-average participation. The immediate level to watch is $134.70, the 20-day resistance and latest close. Holding above it would keep the stock at the top of its recent range; a retreat would put the $134.21 SMA50 and then the $128.35 SMA20 in focus. The 20-day support is $123.73, close to the three-month low of $123.47. A fall below $123.73 would weaken the short-term setup, while the higher three-month peak at $145.90 remains a separate reference point rather than a near-term signal.Technical Verdict: HOLD (wait & see)
HOLD (wait & see) best fits the mixed evidence: the price is above both moving averages and MACD momentum is positive, but the shares are at 20-day resistance, beyond the upper Bollinger Band, and overbought on Stochastic. Below-average volume also limits confirmation of the breakout attempt. - Ideal Entry Range: $128.35–$134.21, bounded by the SMA20 and SMA50. - Exit Target (Target Price): $134.70, the stated 20-day resistance and latest close. - Stop Loss protection: $123.73, the 20-day support. - Invalidation: This verdict is invalidated if the price falls below $123.73. For non-traders, the chart shows improving momentum, but the price is pressing against resistance before the move has been firmly confirmed.Summary Data PEP
| Last price | 134.70 USD |
| Change 1 day / 5 days / 1 month | 0.51% / 4.20% / 3.47% |
| Trend / MA-cross | sideways / none |
| SMA20 / SMA50 | 128.35 / 134.21 |
| RSI (14) / Stochastic %K | 61.5 / 93.5 |
| Bollinger %B / ATR | 104% / 2.84 |
| Support / Resistance 20 days | 123.73 / 134.70 |
| Data as of | 22 October 2026 03:00 WIB |
Disclaimer: This technical analysis is generated automatically from exchange data (via Yahoo Finance) and indicators calculated by JournalArta, for information and education only. The verdict and the entry, target and stop-loss levels are not investment advice or a solicitation to buy or sell any security. Investment decisions and their risks rest solely with the reader.
Track PEP stock price daily: live levels, support/resistance and our full PEP analysis history.