RSI Overbought, COST Stock Gains 0.37% on Wednesday
On October 21, 2026: price 998.31 USD, trend uptrend, RSI 74.6, support 896.48, resistance 998.31. technical analysis of cost stock. RSI Overbought — full…
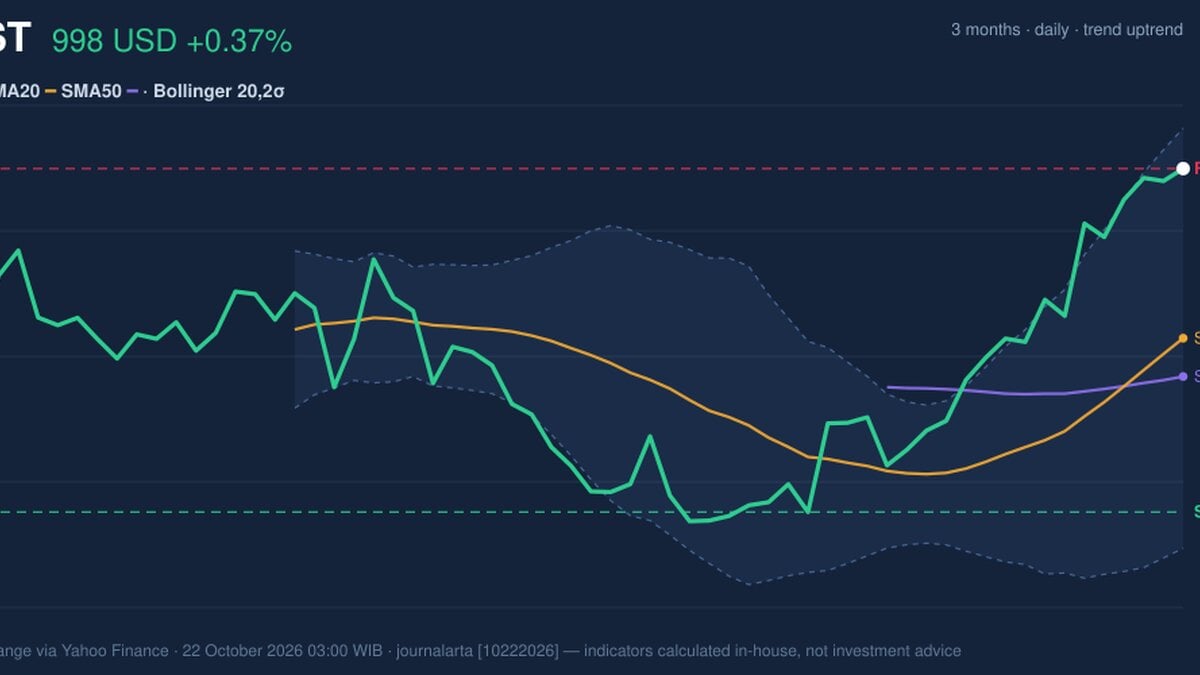
Why COST is in focus today
- Closed at a 20-day high (998.31)
- Trading near its 3-month high (1,008.37)
- Fresh golden cross: SMA20 crossed above SMA50
- RSI(14) at 74.6 — overbought zone
- Uptrend confirmed (5-day change 1.66%)
Selected automatically from 32 NASDAQ (US) stocks by a technical-signal score with daily weighted randomisation — not a recommendation.
Trend & Price Action
Costco’s price is above its 20-day SMA of $948.03 and its 50-day SMA of $936.66, with the shorter average leading the longer one. This alignment supports the uptrend, while the steep recent move means the gap between the share price and those averages is also a measure of how far the stock has run in a short period. The Bollinger Bands, which show how far a price is moving from its recent average, place Costco at 90% of the distance from the lower band to the upper band. The upper band is $1,010.32, while the middle band is $948.03. The 13.1% band width is described as normal, so the data do not show an unusually tight market setup ahead of a volatility burst. Instead, price is testing the upper part of its recent range. The trend is firm, but the share price is already near the top of its technical range.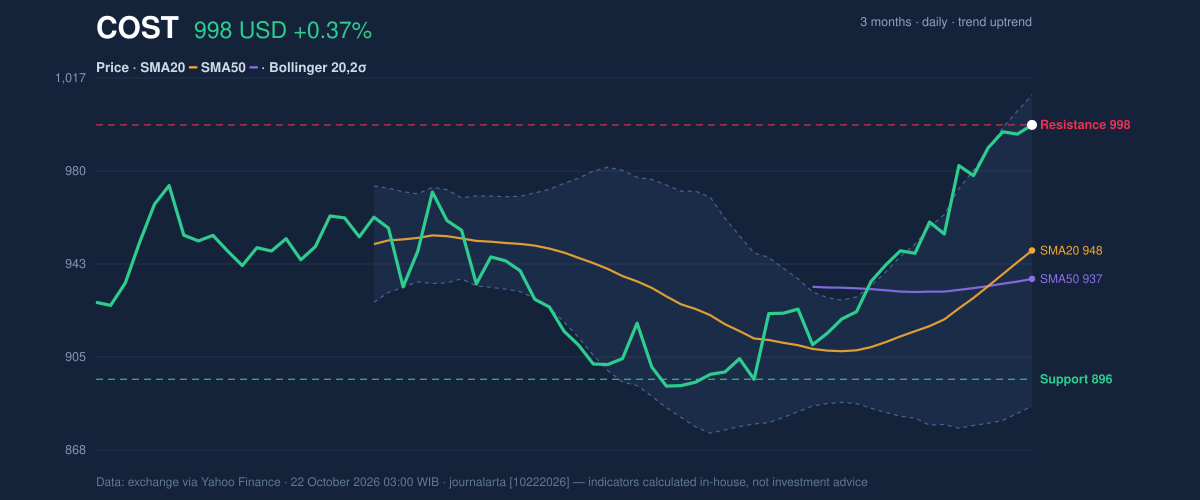
Oscillators & Momentum
Momentum indicators confirm the recent advance, though they also warn that buyers may have pushed the move hard. The relative strength index, or RSI, is 74.6; readings above 70 are commonly treated as overbought, meaning the pace of gains may be difficult to sustain without a pause. The Stochastic reading is similarly stretched, with %K at 89.8 and %D at 88.1. RSI and Stochastic are both in overbought territory. That does not by itself signal a reversal, but it raises the risk that the stock could consolidate or pull back even if the broader trend remains positive. The MACD, a trend-and-momentum measure, is more supportive: its reading of 19.627 is above its 12.874 signal line, and its positive 6.753 histogram shows that upward momentum remains in place. The indicators therefore tell a mixed but coherent story: the trend is rising and MACD confirms it, while the oscillators say the advance is extended. The next test is whether price can hold near resistance without momentum cooling sharply.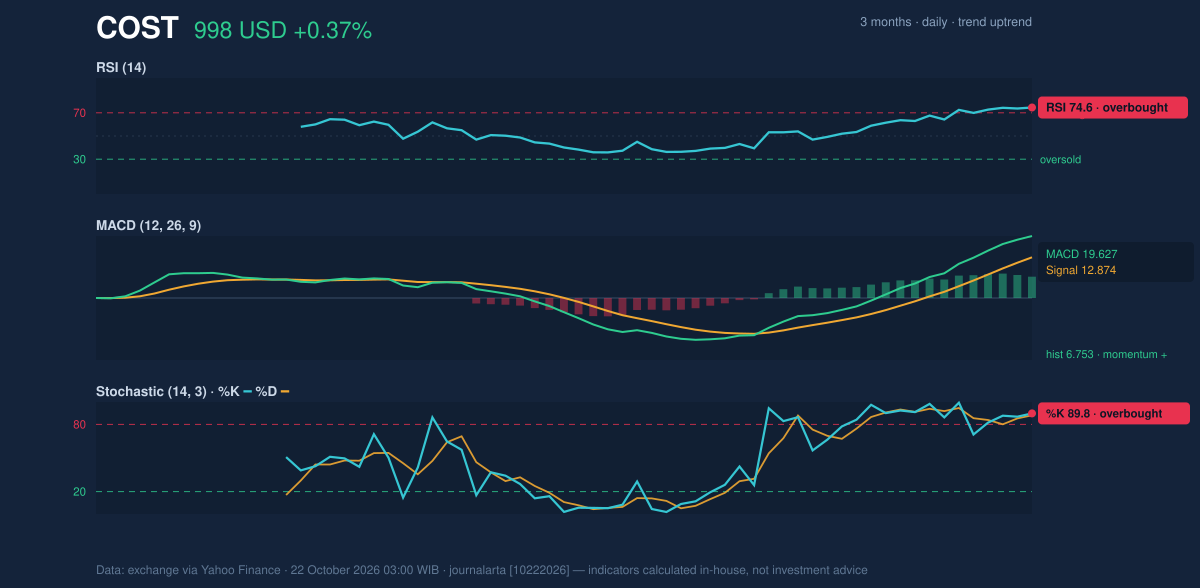
Volatility, Volume & Key Levels
Costco’s average true range (ATR), a measure of typical price movement, is $15.17, or 1.5% of the share price—consistent with moderate volatility. The latest volume was 1,499,805 shares, about 0.7 times the 20-day average of 2,252,260. That thinner participation makes the latest push to a 20-day high less forcefully confirmed by trading activity. On the other hand, on-balance volume (OBV), which tracks whether volume is accumulating on rising or falling sessions, is increasing. Volume is below normal even as OBV rises. That is a qualified positive: buying pressure appears to be building across the measure, but the latest session alone did not draw typical participation. The immediate reference points are resistance at $998.31 and support at $896.48, the stated boundaries of the 20-day range. The three-month high of $1,008.37 is the next notable threshold in the supplied data. A sustained move above that high would reinforce the breakout signal; a failure near resistance would leave the moving-average area—particularly the $948.03 20-day SMA—as a nearer trend gauge. A fall below $896.48 would invalidate the technical verdict below.Technical Verdict: HOLD
HOLD (wait & see) is the technical reading, reflecting a strong but increasingly stretched setup rather than a clear failure of the uptrend. The strongest supporting signals are the fresh golden cross and price above both moving averages, alongside positive MACD momentum. Against them, RSI and Stochastic are overbought, and recent volume is below its 20-day average. The verdict is invalidated if price falls below $896.48. The levels below are technical reference points drawn only from the supplied support, resistance and moving-average data.- Ideal entry range: $948.03–$998.31, spanning the 20-day SMA to the stated 20-day resistance.
- Exit target: $1,008.37, the three-month high.
- Stop-loss protection: $896.48, the 20-day support.
| Indicator | Reading |
|---|---|
| Last price | $998.31 |
| Change | +0.37% daily; +1.66% over five days; +10.35% over one month |
| SMA20 / SMA50 | $948.03 / $936.66; golden cross |
| RSI / Stochastic | 74.6; 89.8 / 88.1 |
| MACD / signal | 19.627 / 12.874 |
| Support / resistance | $896.48 / $998.31 |
| Three-month high / low | $1,008.37 / $883.10 |
Summary Data COST
| Last price | 998.31 USD |
| Change 1 day / 5 days / 1 month | 0.37% / 1.66% / 10.35% |
| Trend / MA-cross | uptrend / golden |
| SMA20 / SMA50 | 948.03 / 936.66 |
| RSI (14) / Stochastic %K | 74.6 / 89.8 |
| Bollinger %B / ATR | 90% / 15.17 |
| Support / Resistance 20 days | 896.48 / 998.31 |
| Data as of | 22 October 2026 03:00 WIB |
Disclaimer: This technical analysis is generated automatically from exchange data (via Yahoo Finance) and indicators calculated by JournalArta, for information and education only. The verdict and the entry, target and stop-loss levels are not investment advice or a solicitation to buy or sell any security. Investment decisions and their risks rest solely with the reader.
Track COST stock price daily: live levels, support/resistance and our full COST analysis history.