Testing Support Level, T Stock Drops 6.45% on Wednesday
On October 21, 2026: price 21.91 USD, trend downtrend, RSI 31.8, support 21.91, resistance 25.45. technical analysis of t stock. Testing Support Level — full…
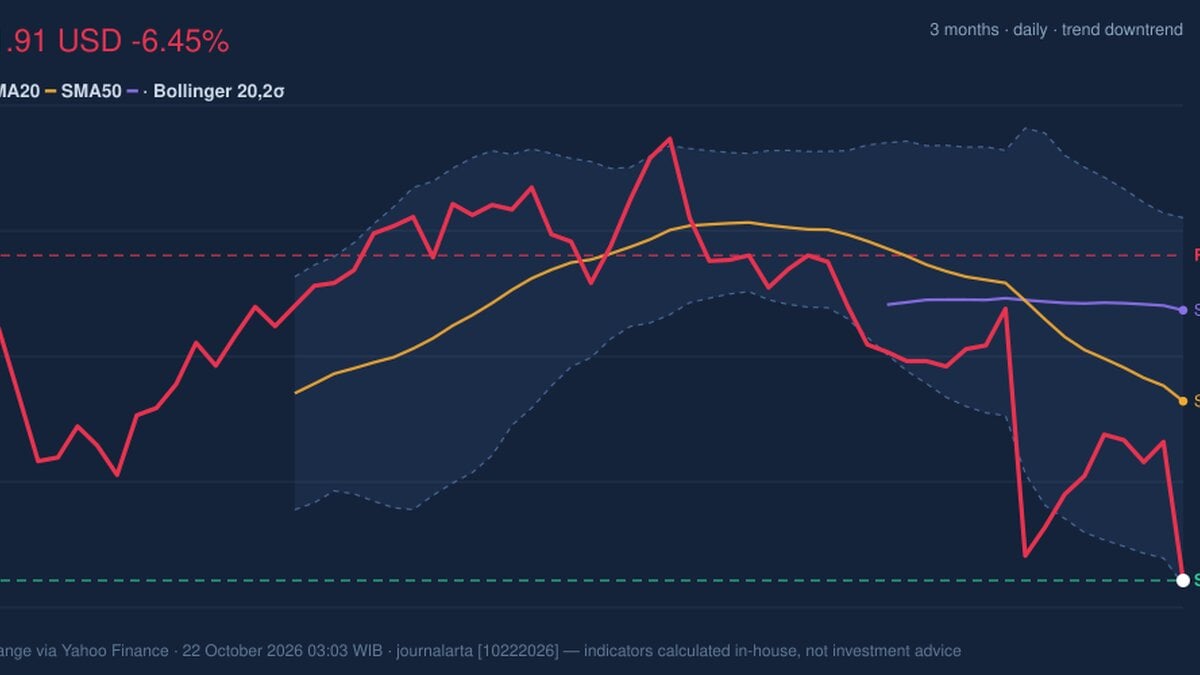
Why T is in focus today
- One-day move of -6.45%, about 1.9× its average daily range (ATR)
- Volume at 1.8× the 20-day average
- Closed at a 20-day low (21.91)
- Trading near its 3-month low (21.79)
- Downtrend extending (5-day change -4.95%)
Selected automatically from 30 NYSE (US) stocks by a technical-signal score with daily weighted randomisation — not a recommendation.
Trend & Price Action
AT&T’s last price of $21.91 sits just above the lower Bollinger Band at $21.87, with the stock at the bottom of its 20-day trading range. Bollinger Bands plot a moving average and volatility-based boundaries around it; a price near the lower band shows persistent pressure, but does not automatically signal a rebound. The band width is 16.7%, described as normal, so the data do not show an unusually compressed setup that would imply a coming breakout. The moving-average picture reinforces the bearish structure. AT&T trades below its SMA20 at $23.86 and SMA50 at $24.85, and the 20-day average has declined 2.29% over five days. There has been no new moving-average crossover, but the absence of a crossover does not neutralize the trend: price remains below both reference lines, and the shorter average is sloping down. As shown in the chart, the gap between the current price and the moving averages puts recent support, rather than trend recovery, at the center of the near-term price action.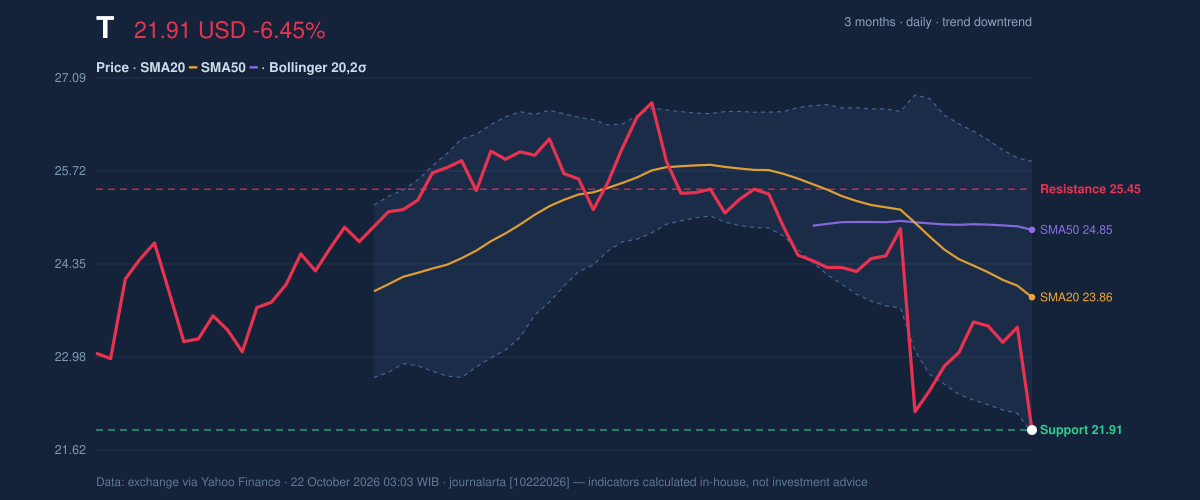
Oscillators & Momentum
The momentum indicators are weak, though they suggest the stock is stretched after its latest decline. The Stochastic is oversold, with %K at 3.8 and %D at 31.2. Stochastic compares a closing price with its recent trading range; a very low reading can indicate intense selling, but it is not a reliable timing signal on its own. The RSI is 31.8, classified as neutral in the supplied data. RSI measures the pace of recent gains and losses; at this level it is close to, but not in, conventional oversold territory. The MACD remains negative at -0.619, below its -0.507 signal line, with a -0.112 histogram. That alignment indicates downside momentum is still prevailing rather than confirming a reversal. The indicators therefore give a mixed short-term message: selling has pushed the Stochastic to an extreme, but the broader momentum signal has not turned upward.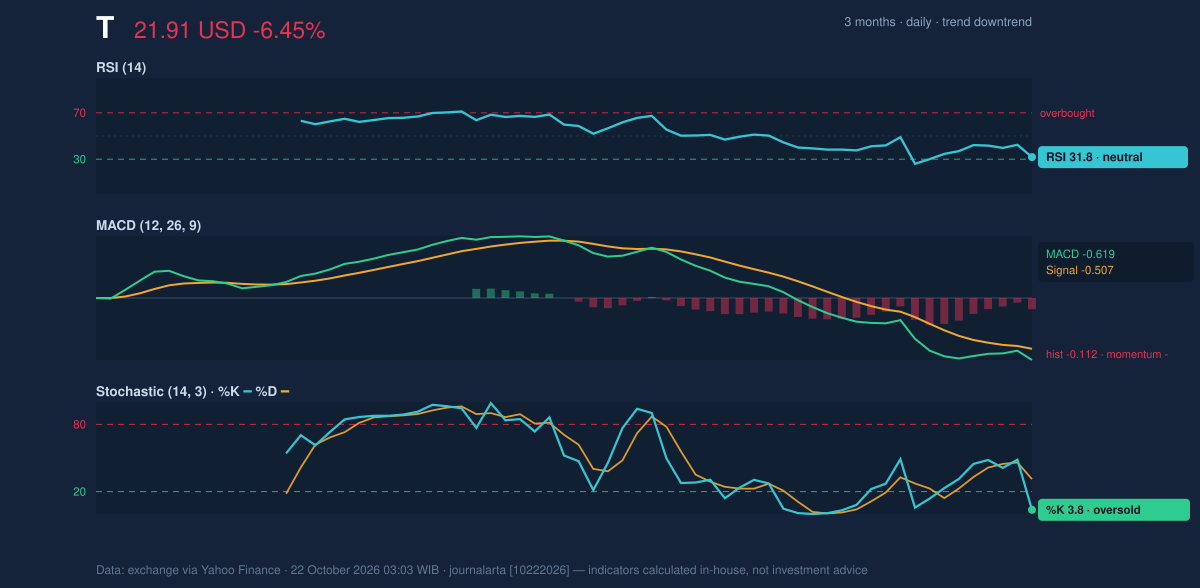
Volatility, Volume & Key Levels
Trading activity adds weight to the decline. Volume was 84,370,448 shares, compared with a 20-day average of 46,779,532, while on-balance volume (OBV)—a running measure that adds volume on rising days and subtracts it on falling days—was also down. High turnover with falling OBV is consistent with selling pressure being broadly reflected in participation, rather than a quiet retreat. Average True Range, a measure of typical price movement, was $0.75, or 3.4% of the share price. That indicates moderate volatility, although the latest daily fall was much larger than the usual range. The close at $21.91 support leaves little room before the three-month low of $21.79. A sustained move below that area would weaken the already fragile price structure; holding it could allow a pause, but would not alone reverse the trend. On any recovery, $23.86 is the first moving-average reference, while $25.45 resistance marks the stated 20-day ceiling. The wider upper Bollinger Band at $25.86 provides another reference, not a forecast. A move back above the shorter moving average would improve the technical picture; until then, the lower highs and falling averages remain the dominant signals.Technical Verdict: HOLD (wait & see)
The indicators support a cautious, neutral verdict rather than a directional call: - Reasons: price is below declining SMA20 and SMA50; MACD is negative and below its signal line; heavy volume and falling OBV confirm selling participation. The oversold Stochastic is a counter-signal, but has not been matched by a positive MACD turn. - Invalidation: this verdict is invalidated if price falls below $21.79, the three-month low. - Reference levels: an indicative entry range is $21.79–$21.91, anchored to the three-month low and 20-day support; the reference exit target is $25.45, the stated resistance; and stop-loss protection is referenced below $21.79. For non-traders, this means AT&T is under clear selling pressure, and the available signals do not yet show that the decline has turned.Summary Data T
| Last price | 21.91 USD |
| Change 1 day / 5 days / 1 month | -6.45% / -4.95% / -13.40% |
| Trend / MA-cross | downtrend / none |
| SMA20 / SMA50 | 23.86 / 24.85 |
| RSI (14) / Stochastic %K | 31.8 / 3.8 |
| Bollinger %B / ATR | 1% / 0.75 |
| Support / Resistance 20 days | 21.91 / 25.45 |
| Data as of | 22 October 2026 03:03 WIB |
Disclaimer: This technical analysis is generated automatically from exchange data (via Yahoo Finance) and indicators calculated by JournalArta, for information and education only. The verdict and the entry, target and stop-loss levels are not investment advice or a solicitation to buy or sell any security. Investment decisions and their risks rest solely with the reader.
Track T stock price daily: live levels, support/resistance and our full T analysis history.