BYD Stock Analysis: Gains 6.23%, Momentum Weakens
On October 23, 2026: price 71.60 HKD, trend downtrend, RSI 39.0, support 67.40, resistance 79.50. technical analysis of byd stock. BYD Stock Analysis — full…
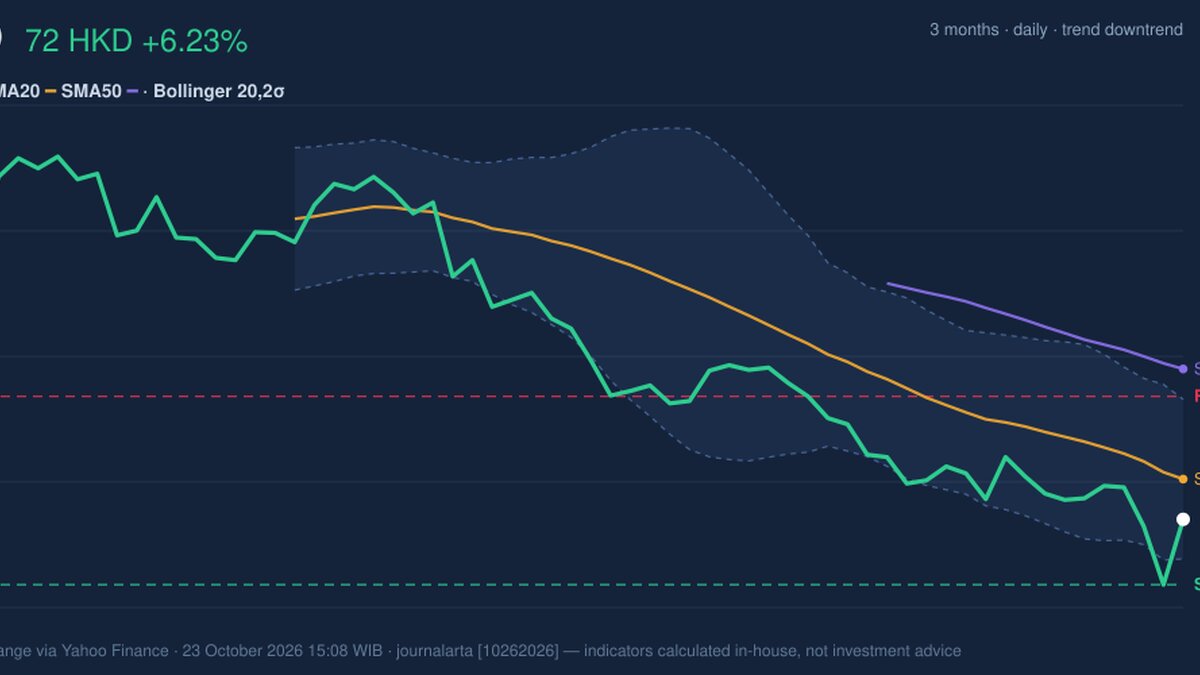
BYD’s Hong Kong-listed shares jumped 6.23% to HK$71.60 on Oct. 23, while trading volume swelled to 2.7 times its 20-day average. The rebound was sharp, but it came within a broader decline: the stock was down 1.85% over five days and 10.89% over one month, with its short-term trend still pointing lower. That contrast matters. Heavy turnover shows the move drew unusually strong participation, but falling on-balance volume and negative MACD suggest the rally has not yet confirmed a durable reversal.
Why BYD is in focus today
- One-day move of 6.23%, about 1.8× its average daily range (ATR)
- Volume at 2.7× the 20-day average
- Downtrend extending (5-day change -1.85%)
Selected automatically from 16 HKEX (Hong Kong) stocks by a technical-signal score with daily weighted randomisation — not a recommendation.
Trend & Price Action
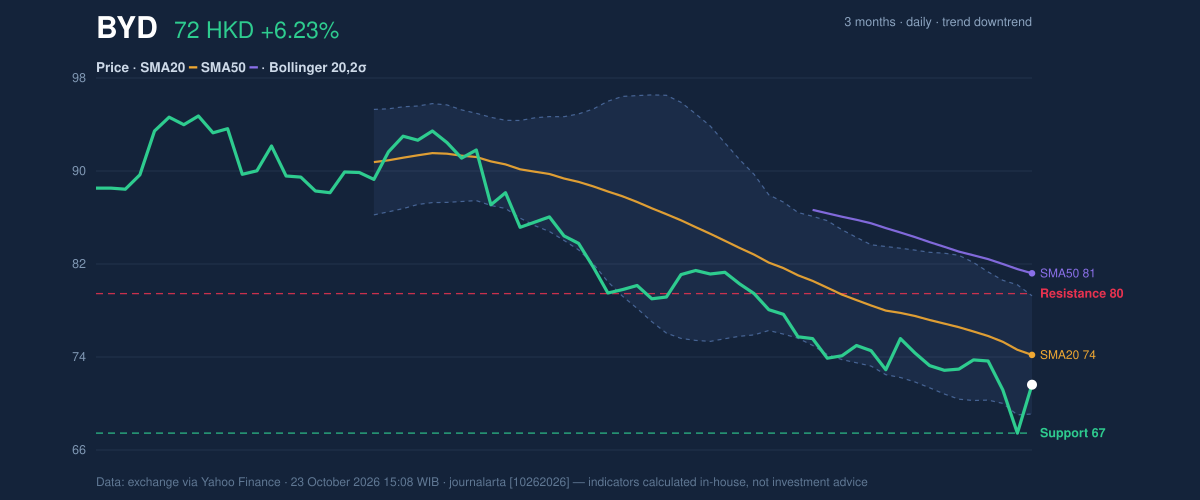
At HK$71.60, BYD remained below its 20-day simple moving average (SMA) of HK$74.18 and its 50-day SMA of HK$81.26. The 20-day average was also declining, down 3.13% over five days. These averages describe the stock’s recent and intermediate trend; trading below both, with the shorter average still sliding, keeps the technical structure weak even after the one-day surge. No new moving-average crossover has formed to signal a change in direction.
The shares sat about 35% of the way through their 20-day range, between support at HK$67.40 and resistance at HK$79.50. They were also close to the three-month low of HK$67.10, a reminder that the latest bounce has not yet carried price far from its recent trough. The closing price did move above the lower Bollinger Band at HK$69.05, but remained below the middle band at HK$74.18. Bollinger Bands frame price around a moving average; the current position points to weakness rather than a confirmed recovery. The band width of 13.8% is normal, not a squeeze that would signal unusually compressed trading.
The 6.23% rebound is notable, but price remains below both moving averages and has yet to reclaim the Bollinger midpoint.
Oscillators & Momentum
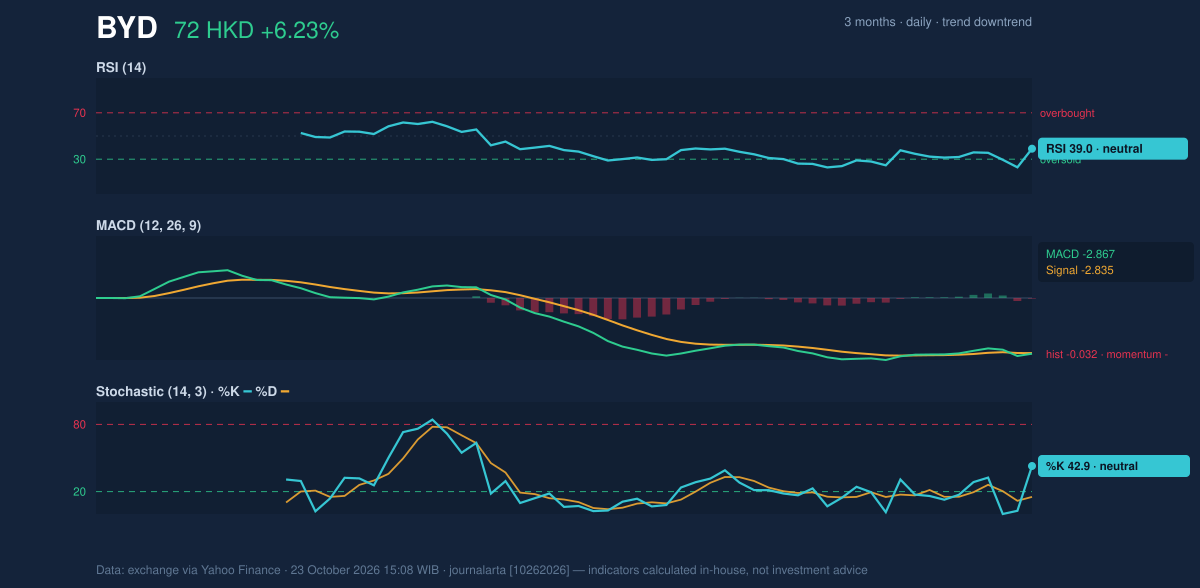
Momentum readings are mixed, not decisively bullish. RSI, a measure of recent buying and selling pressure, stood at 39.0, in neutral territory. That leaves room for a recovery without showing that buyers have established control. The Stochastic readings—%K at 42.9 and %D at 15.2, both neutral—also reflect a bounce in short-term momentum, but do not override the broader downtrend.
MACD, which compares short- and longer-term price momentum, remained negative at -2.867 against a signal line of -2.835, leaving a negative histogram of -0.032. The gap is narrow, so the bearish momentum signal is modest; nevertheless, it has not turned positive. The indicators therefore describe a stock trying to stabilize after a steep slide, rather than one with a confirmed reversal.
Volatility, Volume & Key Levels
The day’s move was about 1.8 times the average daily range, with ATR at HK$2.53, or 3.5% of the share price. ATR estimates typical price movement; at this level, a large daily swing can occur without changing the underlying trend. The volume surge to 51,810,625 shares—against a 20-day average of 19,078,833—makes the rebound harder to dismiss as a quiet drift. Yet OBV, which tracks whether volume is accumulating on up days or down days, was falling. That divergence cautions that the broader flow of trading has not yet turned decisively supportive.
HK$67.40 is the key 20-day support; a break below it would expose the three-month low at HK$67.10. On the upside, resistance at HK$79.50 is close to the upper Bollinger Band at HK$79.31. A sustained move through that area would be more meaningful evidence of recovery than a single-session jump. Before then, the SMA20 at HK$74.18 is an intermediate hurdle; failure to reclaim it would leave the stock below a declining trend measure.
Technical Verdict: HOLD (wait & see)
HOLD (wait & see) best fits the mixed technical picture: the unusually high volume and rebound from near support are constructive, but the declining SMA20, price below both moving averages, negative MACD and falling OBV argue against calling a trend reversal. The verdict is invalidated if price falls below HK$67.40, the 20-day support.
- Ideal entry range: HK$69.05–HK$74.18, bounded by the lower Bollinger Band and SMA20.
- Exit target: HK$79.31–HK$79.50, where the upper Bollinger Band meets 20-day resistance.
- Stop-loss protection: Below HK$67.40, the 20-day support level.
In plain English, the rebound is worth watching, but the chart has not yet shown that the longer decline is over.
Summary Data BYD
| Last price | 71.60 HKD |
| Change 1 day / 5 days / 1 month | 6.23% / -1.85% / -10.89% |
| Trend / MA-cross | downtrend / none |
| SMA20 / SMA50 | 74.18 / 81.26 |
| RSI (14) / Stochastic %K | 39.0 / 42.9 |
| Bollinger %B / ATR | 25% / 2.53 |
| Support / Resistance 20 days | 67.40 / 79.50 |
| Data as of | 23 October 2026 15:08 WIB |
Disclaimer: This technical analysis is generated automatically from exchange data (via Yahoo Finance) and indicators calculated by JournalArta, for information and education only. The verdict and the entry, target and stop-loss levels are not investment advice or a solicitation to buy or sell any security. Investment decisions and their risks rest solely with the reader.
Track BYD share price daily: live levels, support/resistance and our full BYD analysis history.