BP Stock Technicals: Drops 1.21% on Monday, Testing Key Resistance
On October 26, 2026: price 630.80 GBp, trend uptrend, RSI 68.0, support 549.40, resistance 638.50. technical analysis of bp stock. BP Stock Technicals — full…
Why BP is in focus today
- Trading near its 3-month high (638.54)
- Uptrend confirmed (5-day change 2.34%)
Selected automatically from 16 LSE (UK) stocks by a technical-signal score with daily weighted randomisation — not a recommendation.
Trend & Price Action
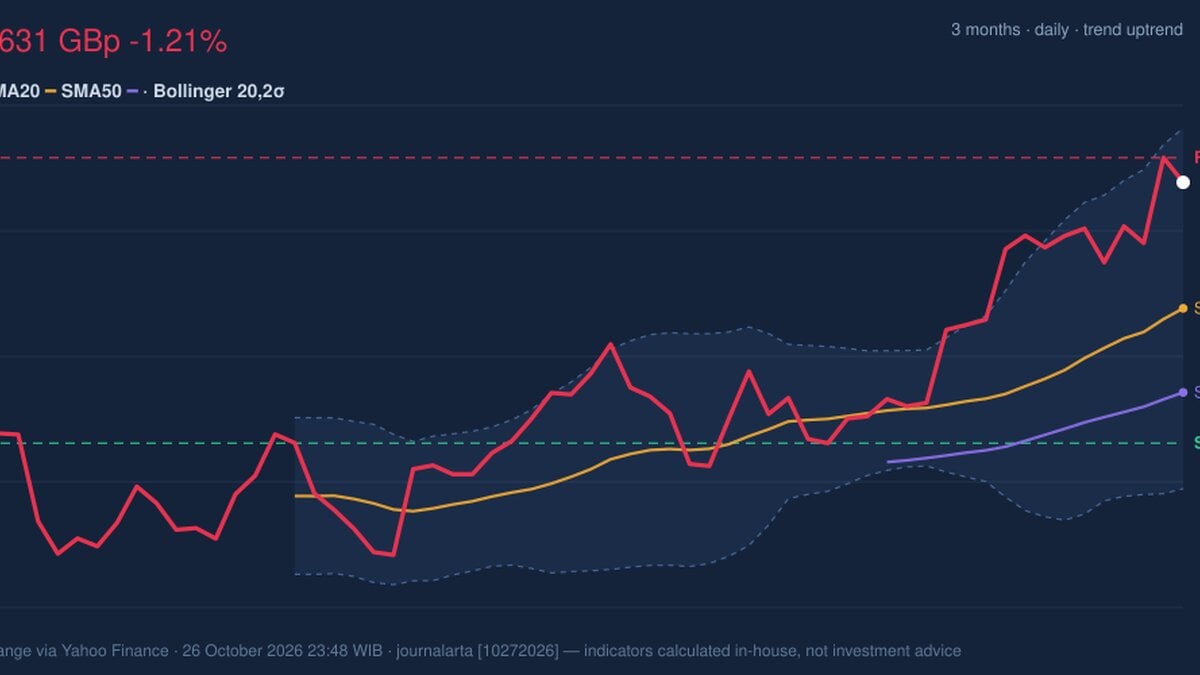
The broader technical structure remains positive. BP is above its rising 20-day simple moving average (SMA) of 591.48 GBp and its 50-day SMA of 565.24 GBp. A simple moving average smooths recent prices to help show direction; here, the shorter-term average is also above the longer-term one, although the data show no new moving-average crossover. The 20-day SMA has risen 2.70% over five days, suggesting the upward trend is gaining support rather than merely reflecting a brief jump. But the share price is pressing into an important ceiling. At 630.80 GBp, BP is near its three-month high of 638.54 GBp and has covered 91% of its 20-day trading range, between support at 549.40 GBp and resistance at 638.50 GBp. That positioning signals strength, but it also leaves relatively little room before the price meets an area where sellers may emerge. As shown in the chart, the price is approaching the upper Bollinger Band at 647.74 GBp, while the band’s midpoint sits at 591.48 GBp. Bollinger Bands widen or contract with price volatility; BP’s bands are at a normal width, not showing a squeeze that might precede a sharp move. The reading of 85% on the band scale places the stock in the upper portion of its recent range, reinforcing the picture of an extended rally rather than a confirmed reversal.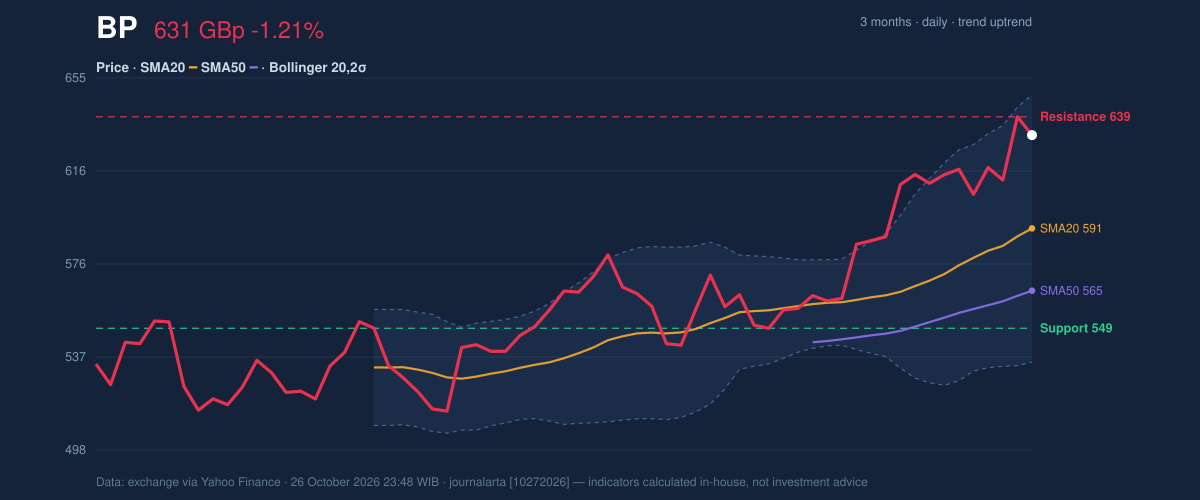
Oscillators & Momentum
Momentum indicators mostly support the trend, but one is flashing caution. The RSI is 68.0, classified as neutral in the supplied data. RSI compares recent gains and losses; a reading near 70 is often watched for signs that a move may be stretched, but this reading alone does not establish a turn lower. The Stochastic oscillator, which compares the latest close with its recent price range, is more emphatic: %K is 90.3 and %D is 90.6, both in overbought territory. That can reflect persistent buying during a strong advance, not necessarily an imminent decline. However, it raises the risk that momentum could cool if the share price fails to clear resistance. The MACD, a trend-and-momentum measure, remains constructive: MACD at 18.817 is above its signal line at 15.766, with a positive histogram of 3.051. The histogram measures the gap between the two lines, so its positive reading indicates that upward momentum is still prevailing. As shown in the chart, the contrast is between a positive MACD and an overbought Stochastic—not a clean bearish reversal.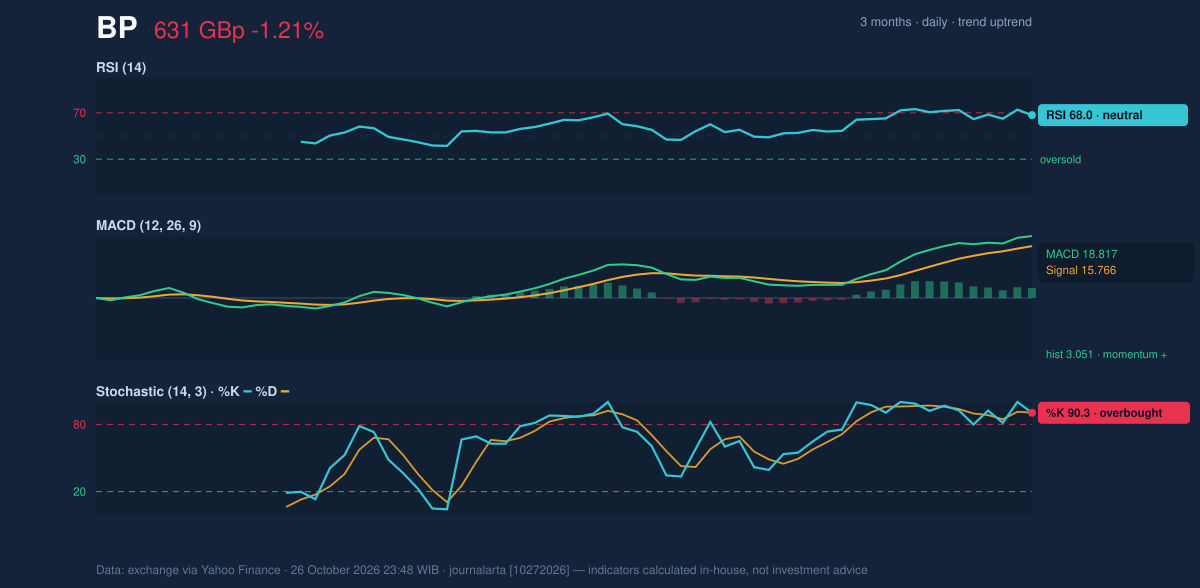
Volatility, Volume & Key Levels
Average true range (ATR), which estimates typical daily price movement, is 15.99 GBp, or 2.5% of the share price: moderate volatility. The latest volume was 32.15 million shares, about 0.7 times the 20-day average of 44.79 million. The rally is therefore not accompanied by unusually heavy trading in the latest session. On the other hand, on-balance volume (OBV), a measure that tracks whether volume tends to accompany rising or falling prices, is rising—evidence that participation has been broadly supportive. Resistance at 638.50 GBp is the immediate test. A sustained move above it would put the three-month high of 638.54 GBp in focus, with the upper Bollinger Band at 647.74 GBp another reference point. Failure to clear the resistance, particularly alongside overbought Stochastic readings, could instead bring the 20-day SMA at 591.48 GBp into view. The deeper 20-day support at 549.40 GBp marks a more substantial test of the underlying structure.Technical Verdict: HOLD (wait & see)
The technical verdict is HOLD (wait & see): the uptrend and positive MACD remain intact, but overbought Stochastic readings and nearby resistance argue against treating momentum as a clear breakout. - Indicative entry range: 591.48–638.50 GBp, bounded by the 20-day SMA and 20-day resistance. - Exit target (target price): 647.74 GBp, the upper Bollinger Band. - Stop-loss protection: 549.40 GBp, the 20-day support level. - Invalidation: The verdict is invalidated if the price falls below 549.40 GBp. For non-traders, the chart still points upward, but the share is close to a ceiling and short-term momentum looks stretched.Summary Data BP
| Last price | 630.80 GBp |
| Change 1 day / 5 days / 1 month | -1.21% / 2.34% / 11.94% |
| Trend / MA-cross | uptrend / none |
| SMA20 / SMA50 | 591.48 / 565.24 |
| RSI (14) / Stochastic %K | 68.0 / 90.3 |
| Bollinger %B / ATR | 85% / 15.99 |
| Support / Resistance 20 days | 549.40 / 638.50 |
| Data as of | 26 October 2026 23:48 WIB |
Disclaimer: This technical analysis is generated automatically from exchange data (via Yahoo Finance) and indicators calculated by JournalArta, for information and education only. The verdict and the entry, target and stop-loss levels are not investment advice or a solicitation to buy or sell any security. Investment decisions and their risks rest solely with the reader.
Track BP share price daily: live levels, support/resistance and our full BP analysis history.