Diageo Stock Analysis: Drops 0.84%, Golden Cross Formed
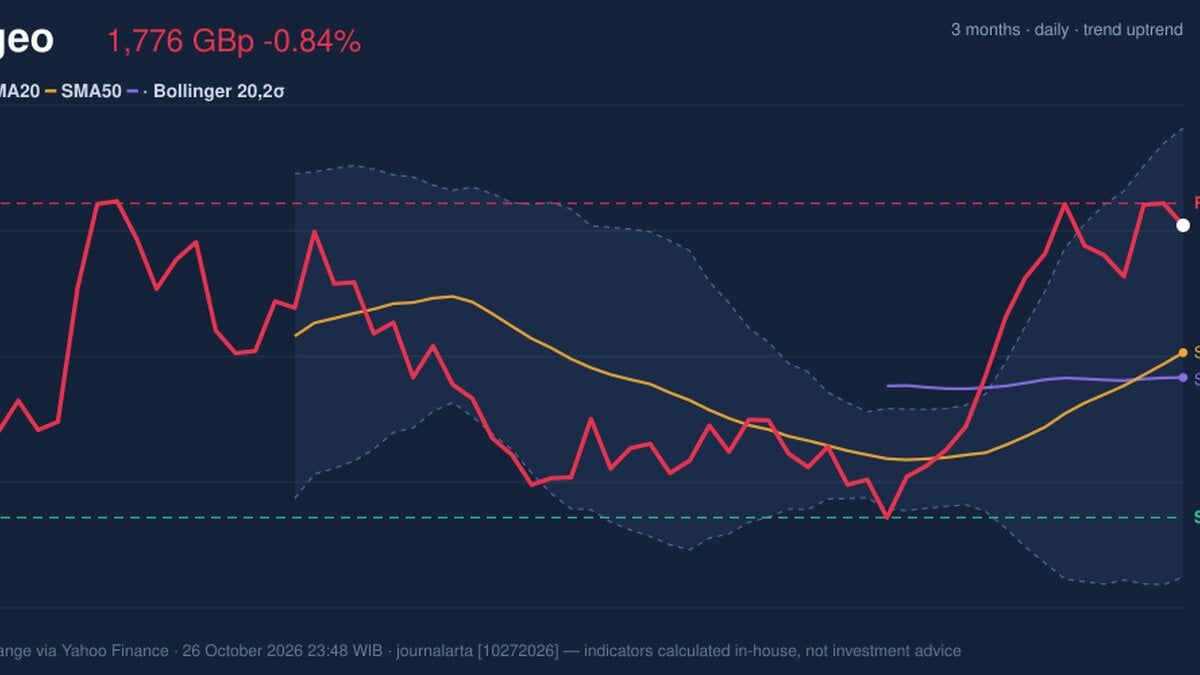
On October 26, 2026: price 1,775.50 GBp, trend uptrend, RSI 64.4, support 1,575.50, resistance 1,790.50. technical analysis of diageo stock.
Why Diageo is in focus today
- Fresh golden cross: SMA20 crossed above SMA50
Selected automatically from 16 LSE (UK) stocks by a technical-signal score with daily weighted randomisation — not a recommendation.
Trend & Price Action
Diageo’s 20-day simple moving average, or SMA, is 1,688.35 GBp, above the 50-day SMA at 1,671.37 GBp. The 20-day average has risen 2.08% over five days and recently crossed above the 50-day line, forming a golden cross. This crossover suggests that recent buying has been strong enough to improve the short-term trend relative to the longer-term one; it is a confirmation signal, not a guarantee that gains will continue. The price is about 93% of the way through its stated 20-day range, near the upper boundary rather than the middle. It is also approaching the three-month high of 1,827.93 GBp. That proximity makes resistance especially important: a sustained move above it would strengthen the case that the advance is extending, while repeated failure there would point to a pause or pullback within the rising trend.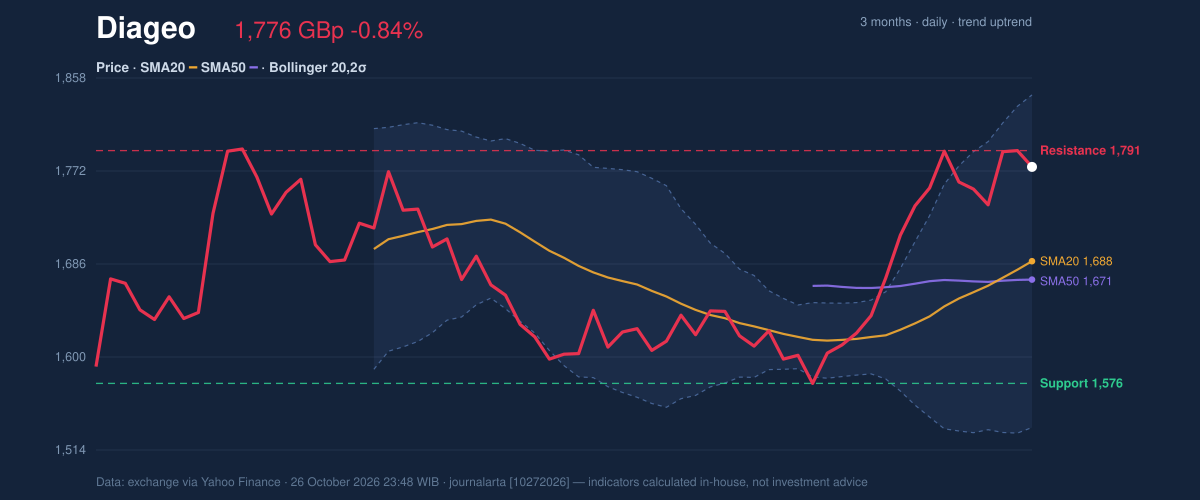
Oscillators & Momentum
Momentum indicators support the trend, but they do not all tell the same story. The MACD is positive, at 38.835 against a signal line of 27.557, with a positive histogram of 11.278. MACD compares shorter- and longer-term price momentum; a reading above its signal line indicates that upward momentum remains in place. The RSI is 64.4, in neutral territory, rather than at an extreme that would alone signal an overheated market. But the Stochastic is overbought: its %K reading of 83.6 is below %D at 90.2. This oscillator measures where the latest price sits within its recent range. Its elevated readings suggest the shares may be vulnerable to a short-term cooling, even as the MACD and moving averages remain constructive.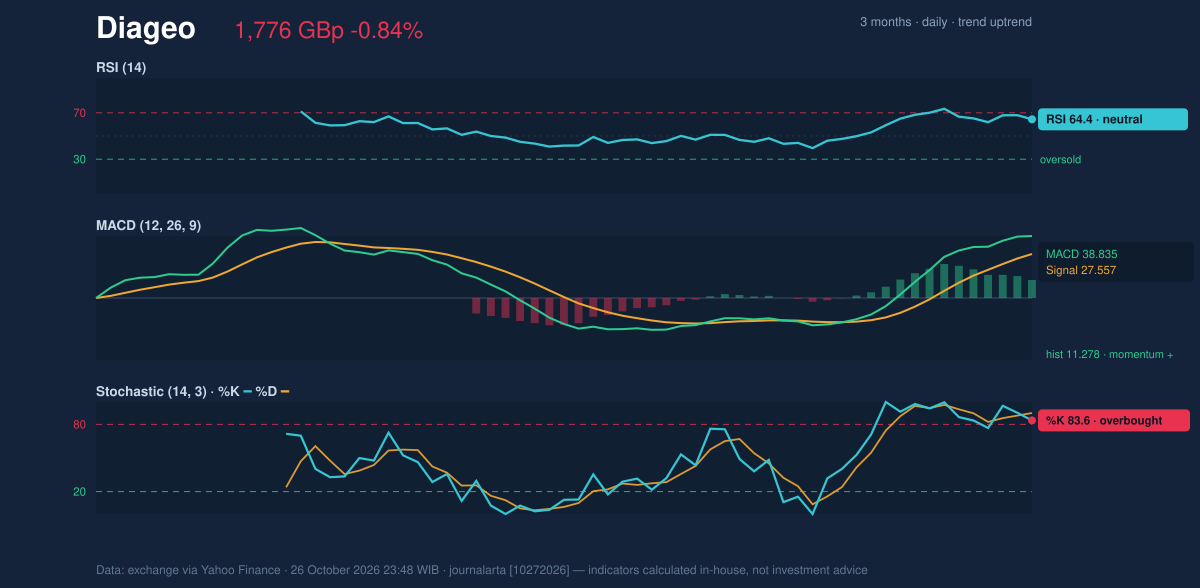
Volatility, Volume & Key Levels
The Bollinger Bands, which track price relative to a moving average and its recent volatility, place Diageo at 78% of the band’s range. The upper band is 1,841.95 GBp, the midpoint 1,688.35 GBp and the lower band 1,534.75 GBp. A normal band width of 18.2% indicates volatility is neither unusually compressed nor sharply expanding. The price is in the upper part of the band, consistent with strength but leaving less room before the upper boundary. Trading volume was 2,634,663 shares, about half the 20-day average of 5,350,887, so participation was thin on the latest session. That makes the day’s price action less persuasive as evidence of a broad shift in sentiment. On the other hand, OBV, a measure that accumulates volume according to whether prices rise or fall, is increasing. Its direction suggests buying pressure has been building, though the light latest volume warrants caution. The key 20-day resistance is 1,790.50 GBp, while support is 1,575.50 GBp. A close above resistance would put the three-month high of 1,827.93 GBp in focus; failure to hold above the moving averages could instead weaken the near-term structure. The average true range, a measure of typical daily price movement, is 40.64 GBp, or 2.3% of the share price, pointing to moderate volatility rather than unusually wide swings.Technical Verdict: HOLD (wait & see)
The technical balance supports a neutral verdict while price tests resistance. The main reasons are the positive golden cross and rising SMA20, positive MACD momentum, and the overbought Stochastic alongside thin latest-session volume. The verdict is invalidated if price falls below 1,575.50 GBp, the stated 20-day support.- Ideal entry range: 1,688.35–1,775.50 GBp, bounded by the SMA20 and latest close.
- Exit target: 1,827.93 GBp, the three-month high.
- Stop-loss protection: 1,575.50 GBp, the stated 20-day support.
| Indicator | Reading |
|---|---|
| Last price | 1,775.50 GBp |
| SMA20 / SMA50 | 1,688.35 / 1,671.37 GBp |
| RSI / Stochastic | 64.4 / 83.6 (%K), 90.2 (%D) |
| MACD / signal / histogram | 38.835 / 27.557 / 11.278 |
| Support / resistance | 1,575.50 / 1,790.50 GBp |
Summary Data Diageo
| Last price | 1,775.50 GBp |
| Change 1 day / 5 days / 1 month | -0.84% / 0.79% / 9.63% |
| Trend / MA-cross | uptrend / golden |
| SMA20 / SMA50 | 1,688.35 / 1,671.37 |
| RSI (14) / Stochastic %K | 64.4 / 83.6 |
| Bollinger %B / ATR | 78% / 40.64 |
| Support / Resistance 20 days | 1,575.50 / 1,790.50 |
| Data as of | 26 October 2026 23:48 WIB |
Disclaimer: This technical analysis is generated automatically from exchange data (via Yahoo Finance) and indicators calculated by JournalArta, for information and education only. The verdict and the entry, target and stop-loss levels are not investment advice or a solicitation to buy or sell any security. Investment decisions and their risks rest solely with the reader.
Track Diageo share price daily: live levels, support/resistance and our full Diageo analysis history.