GS Stock Gains 1.47% on Wednesday, Testing Key Resistance
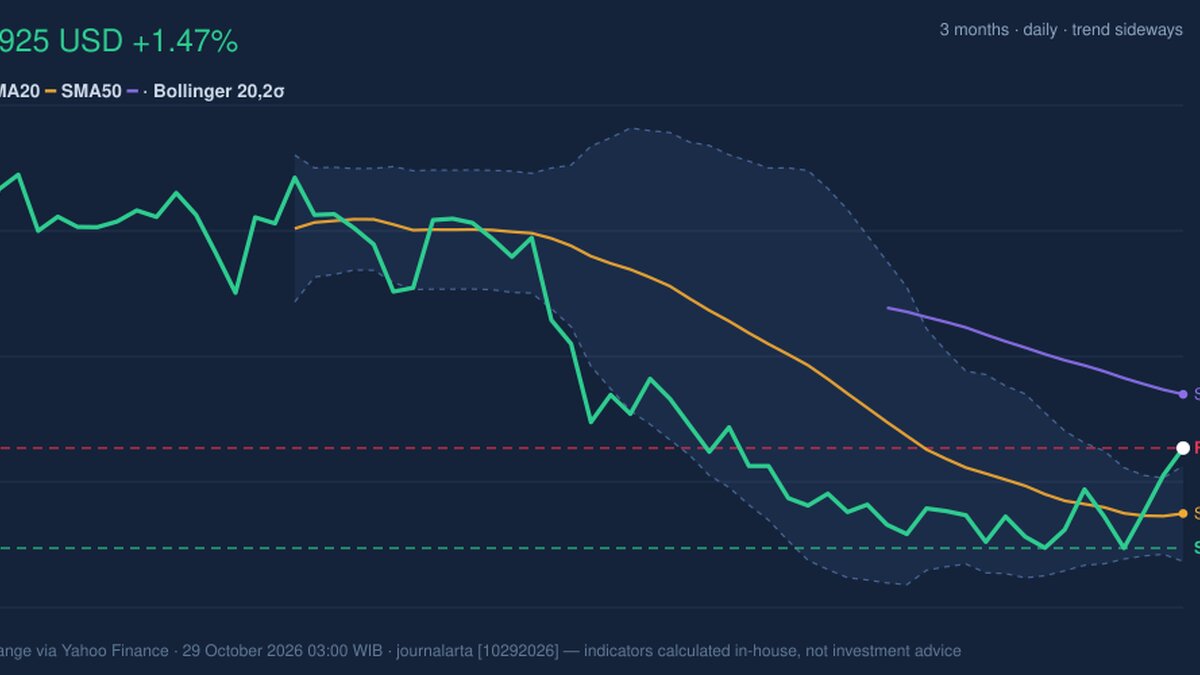
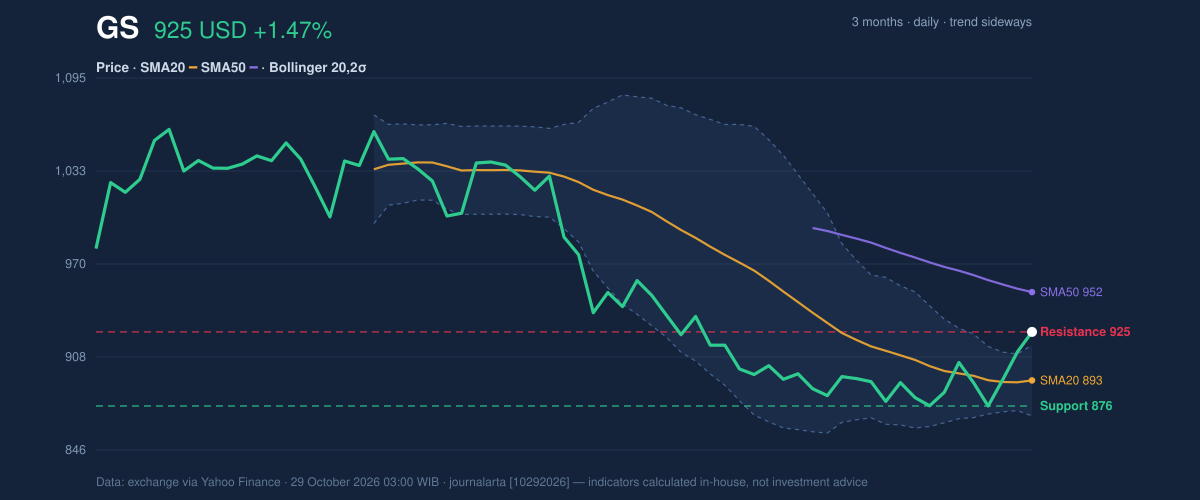
On October 28, 2026: price 925.17 USD, trend sideways, RSI 54.6, support 875.68, resistance 925.17. technical analysis of gs stock. GS Stock Gains — full…
Why GS is in focus today
- Closed at a 20-day high (925.17)
- Breaking out of a Bollinger squeeze (band width 5.3%)
Selected automatically from 30 NYSE (US) stocks by a technical-signal score with daily weighted randomisation — not a recommendation.
Trend & Price Action
Oscillators & Momentum
The momentum indicators offer support, but not a clean confirmation. The RSI is neutral at 54.6, a reading consistent with neither pronounced buying pressure nor a deeply oversold market. The MACD histogram is positive at 7.518, and the MACD at -11.394 is above its signal line at -18.911. That configuration points to improving momentum, even though both MACD figures remain below zero. The stochastic reading is the main caution: %K at 91.9 and %D at 70.9 are in overbought territory. The indicator compares a closing price with its recent trading range; a high reading can reflect strong near-term momentum, but it also warns that the advance may be vulnerable to a pause. It does not, on its own, establish that a reversal has begun. Momentum is improving, but the overbought stochastic leaves the breakout needing confirmation. [ GRAFIK-MOMENTUM ]Volatility, Volume & Key Levels
The day’s move broke above the upper Bollinger band, while the squeeze points to a market that had been trading within a comparatively narrow band. Such compression can precede a larger move, but the direction is not guaranteed by the squeeze itself. Average true range, a measure of typical price movement, stood at $25.38, or 2.7% of the share price—moderate volatility that gives context to the potential size of daily swings. Participation was less convincing. Volume was 1,896,400 shares, about 0.8 times the 20-session average of 2,310,490. On-balance volume, which tracks whether volume tends to accompany gains or losses, was rising. That provides some support for accumulation, although below-average turnover means the breakout did not attract unusually heavy trading. The immediate test is whether Goldman can hold above the $925.17 resistance that also marks the 20-session range high. A sustained move above that level would strengthen the breakout case; a failure to hold it would leave the price exposed to a pullback toward the $892.73 SMA20. The stated 20-session support is $875.68, while the lower Bollinger band sits at $869.04. A drop through support would weaken the short-term structure; the 50-day average at $951.70 is a further reference point overhead.Technical Verdict: HOLD (wait & see)
The technical picture is mixed rather than decisively bullish or bearish. The price has reached a 20-session high and the MACD histogram is positive, but the 20-day average is still declining, trading volume is below its average, and the stochastic is overbought. The verdict is invalidated if the price falls below $875.68, the stated 20-session support.- Ideal Entry Range: $892.73–$925.17, bracketed by the SMA20 and the current 20-session high.
- Exit Target: $951.70, the SMA50 overhead.
- Stop Loss: $875.68, the 20-session support.
| Indicator | Reading |
|---|---|
| Latest price | $925.17 |
| Change | 1 day: 1.47% | 5 days: 2.26% | 1 month: 2.76% |
| SMA20 / SMA50 | $892.73 / $951.70 |
| RSI / Stochastic | 54.6 / %K 91.9, %D 70.9 |
| MACD / signal / histogram | -11.394 / -18.911 / 7.518 |
| ATR / volume | $25.38 / 1,896,400 shares |
| 20-session support / resistance | $875.68 / $925.17 |
Summary Data GS
| Last price | 925.17 USD |
| Change 1 day / 5 days / 1 month | 1.47% / 2.26% / 2.76% |
| Trend / MA-cross | sideways / none |
| SMA20 / SMA50 | 892.73 / 951.70 |
| RSI (14) / Stochastic %K | 54.6 / 91.9 |
| Bollinger %B / ATR | 118% / 25.38 |
| Support / Resistance 20 days | 875.68 / 925.17 |
| Data as of | 29 October 2026 03:00 WIB |
Disclaimer: This technical analysis is generated automatically from exchange data (via Yahoo Finance) and indicators calculated by JournalArta, for information and education only. The verdict and the entry, target and stop-loss levels are not investment advice or a solicitation to buy or sell any security. Investment decisions and their risks rest solely with the reader.
Track GS stock price daily: live levels, support/resistance and our full GS analysis history.