UNH Golden Cross Formed: Stock Drops 0.80% (October 28, 2026)
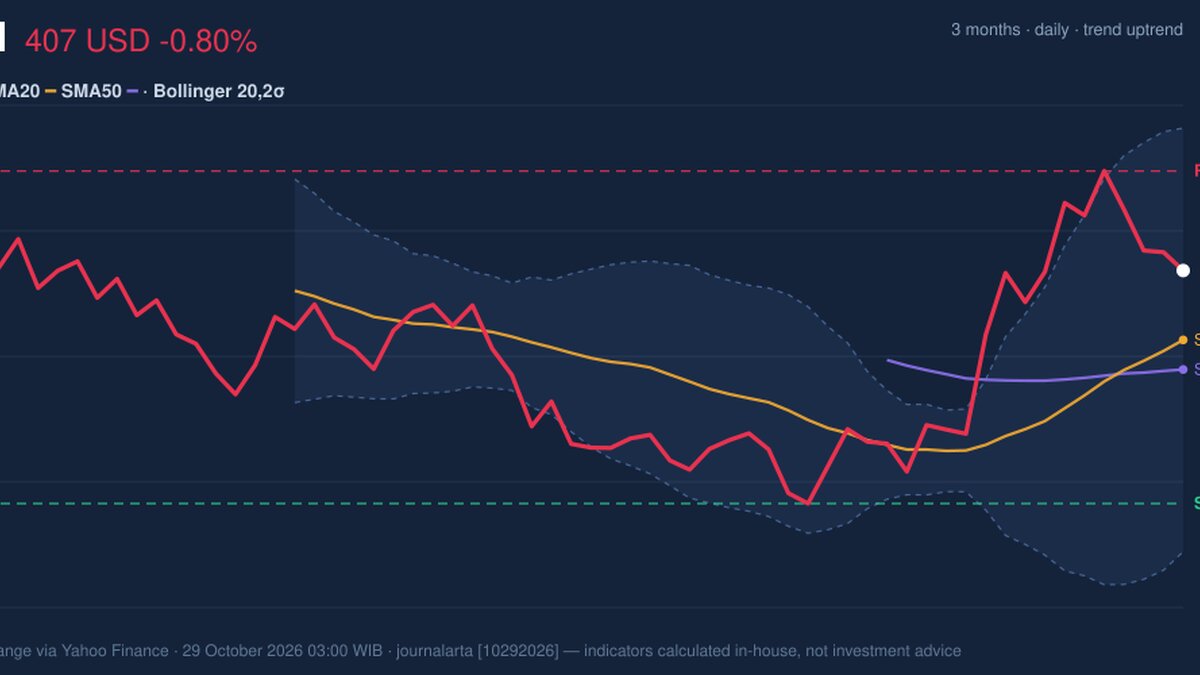
On October 28, 2026: price 407.10 USD, trend uptrend, RSI 56.9, support 365.20, resistance 424.98. technical analysis of unh stock. UNH Golden Cross Formed —…
Why UNH is in focus today
- Fresh golden cross: SMA20 crossed above SMA50
Selected automatically from 30 NYSE (US) stocks by a technical-signal score with daily weighted randomisation — not a recommendation.
Trend & Price Action
The latest decline followed a 2.37% loss over five days, but the stock is still up 10.90% over one month. That combination points to a short-term pause within a stronger recent advance, rather than a settled reversal. At $407.10, the shares sit about 70% of the way through their 20-session range, between support at $365.20 and resistance at $424.98. The three-month high of $431.68 is just above the upper end of that near-term resistance area, while the three-month low is $362.60. The moving averages—SMA20 at $394.63 and SMA50 at $389.31—form a closer reference zone: holding above them would keep the current upward structure intact, while a drop below them would weaken it. As shown in the chart, the share price is above the averages but has not yet cleared resistance.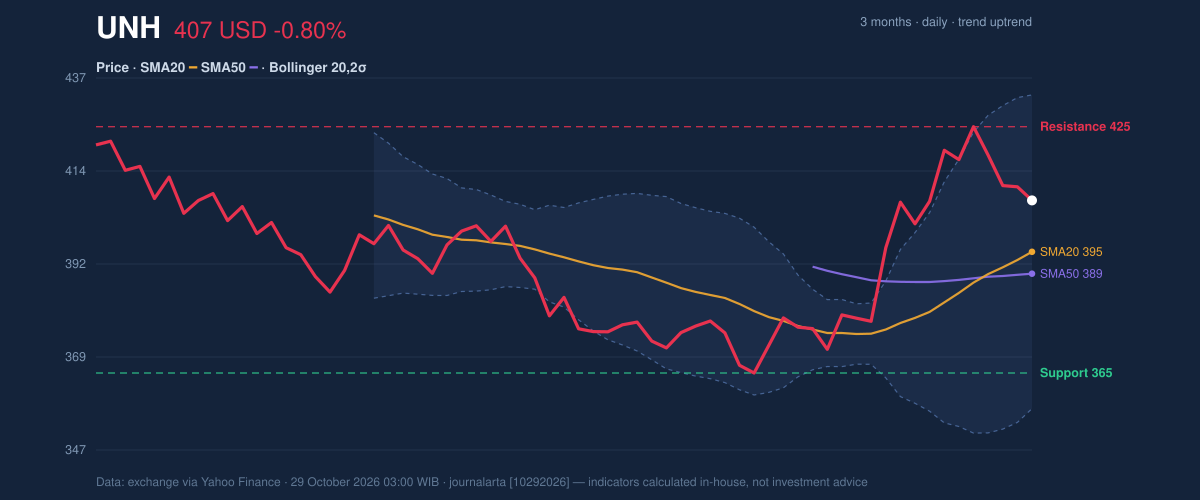
Oscillators & Momentum
Momentum indicators are positive but not stretched. The RSI is neutral at 56.9, placing it between the levels commonly associated with oversold and overbought conditions. The Stochastic is also neutral, with %K at 63.8 and %D at 69.6; %K below %D suggests the most recent momentum reading has cooled, though it does not by itself establish a downturn. The MACD remains positive: its reading of 8.478 is above the 6.626 signal line, leaving a positive histogram of 1.852. This supports the uptrend interpretation, but the contrast between positive MACD and a weaker short-window price move argues for watching whether momentum holds rather than assuming the advance will resume.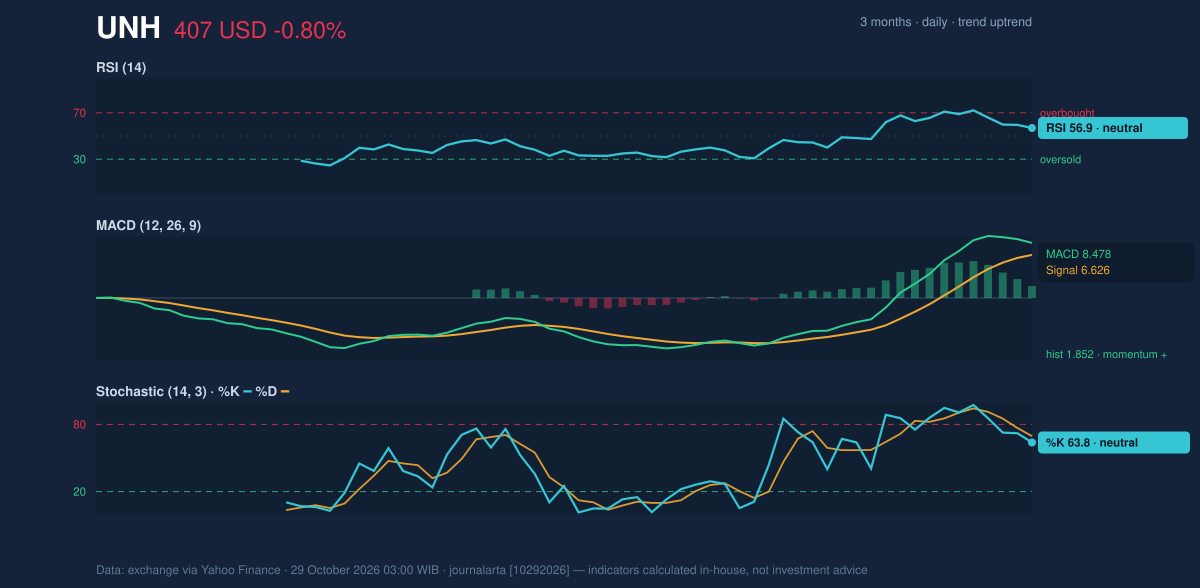
Volatility & Volume
The Bollinger Bands are neither especially tight nor unusually wide. The band width is 19.3%, classified as normal, and the price is at 66% of the distance from the lower band to the upper band. That position leaves room in either direction; it is not a breakout signal. The upper band at $432.70 is near the three-month high, making that area a further test if the shares rise through $424.98. Average true range is $13.29, or 3.3% of the share price, indicating moderate day-to-day volatility. More caution comes from participation: volume was 3,895,500 shares, about 0.6 times the 20-session average of 6,021,055, while OBV—an indicator that tracks whether volume is flowing more heavily on rising or falling sessions—declined. The price trend is improving, but these volume signals do not yet show strong confirmation from trading activity.Technical Verdict: HOLD (wait & see)
The technical picture leans upward, but does not yet show enough confirmation to resolve the tension between positive trend signals and weak participation. The golden cross and price above both moving averages support the trend; positive MACD adds momentum confirmation. Against that, below-average volume and falling OBV make a sustained breakout less certain. - Ideal entry range: $394.63–$407.10, using the SMA20 as the lower reference and the latest price as the upper reference. - Exit target: $424.98–$432.70, spanning 20-session resistance and the upper Bollinger Band. - Stop-loss protection: $389.31, at the SMA50. - Invalidation: The verdict is invalidated if the price falls below $389.31. In plain English, the indicators show an improving trend, but not yet enough trading participation to confirm that it can clear resistance. The latest session’s volume remained below its 20-session average, leaving confirmation of the golden-cross signal as the next technical test.Summary Data UNH
| Last price | 407.10 USD |
| Change 1 day / 5 days / 1 month | -0.80% / -2.37% / 10.90% |
| Trend / MA-cross | uptrend / golden |
| SMA20 / SMA50 | 394.63 / 389.31 |
| RSI (14) / Stochastic %K | 56.9 / 63.8 |
| Bollinger %B / ATR | 66% / 13.29 |
| Support / Resistance 20 days | 365.20 / 424.98 |
| Data as of | 29 October 2026 03:00 WIB |
Disclaimer: This technical analysis is generated automatically from exchange data (via Yahoo Finance) and indicators calculated by JournalArta, for information and education only. The verdict and the entry, target and stop-loss levels are not investment advice or a solicitation to buy or sell any security. Investment decisions and their risks rest solely with the reader.
Track UNH stock price daily: live levels, support/resistance and our full UNH analysis history.