Testing Support Level, NFLX Stock Drops 0.85% on Wednesday
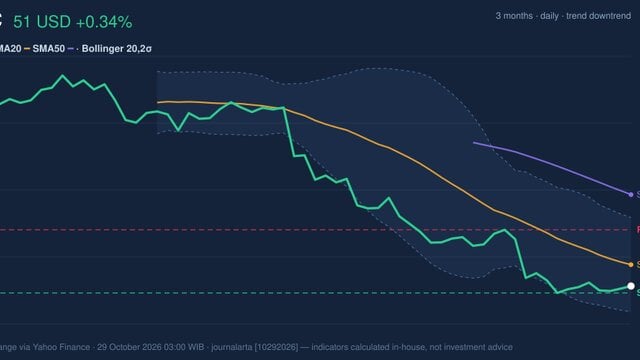
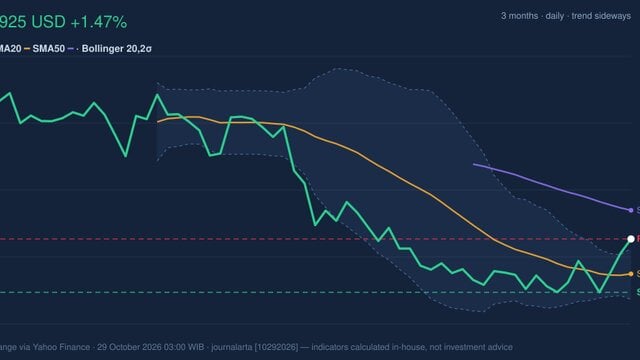
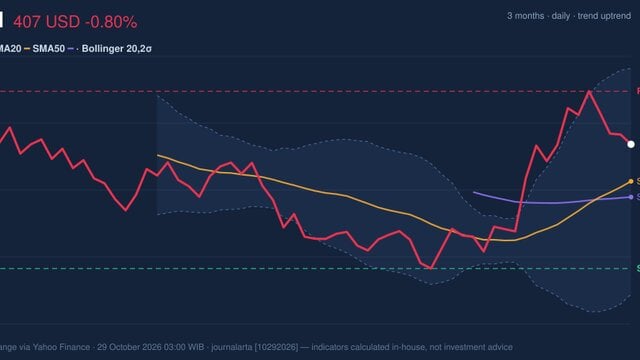
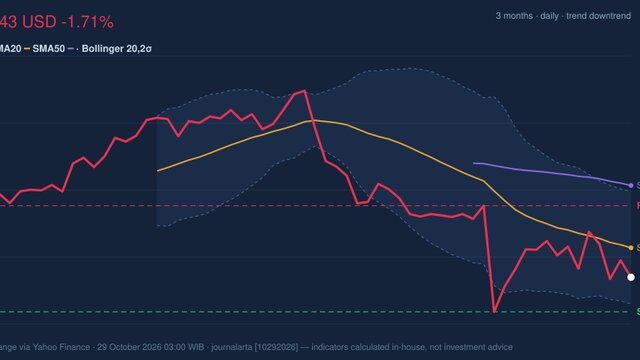
On October 28, 2026: price 61.99 USD, trend downtrend, RSI 30.3, support 61.99, resistance 72.61. technical analysis of nflx stock. Testing Support Level —…
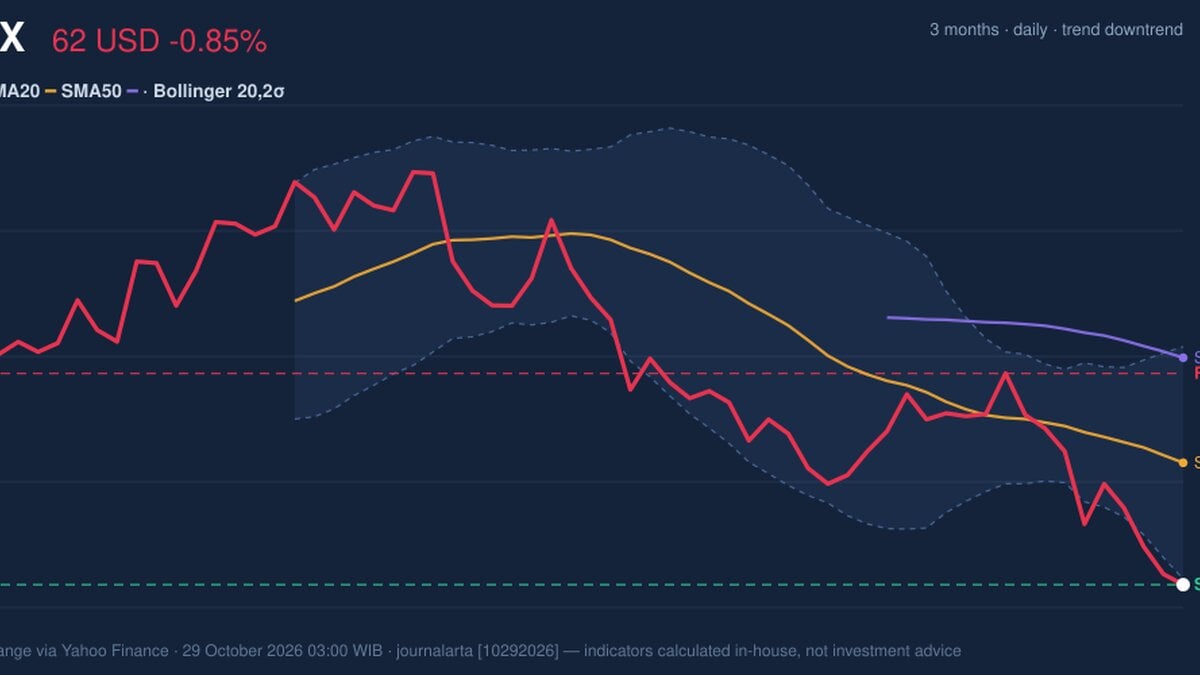
Why NFLX is in focus today
- Closed at a 20-day low (61.99)
- Trading near its 3-month low (61.51)
- Downtrend extending (5-day change -4.69%)
Selected automatically from 32 NASDAQ (US) stocks by a technical-signal score with daily weighted randomisation — not a recommendation.
Trend & Price Action
Oscillators & Momentum
Momentum indicators are weak, with one important qualification: they suggest the decline may be stretched, not that a rebound is confirmed. The RSI is 30.3, classified as neutral in the supplied data. RSI gauges the pace of recent gains and losses; a low reading can reflect persistent selling pressure, but this figure should not be relabelled oversold. The Stochastic is oversold, with %K at 4.2 and %D at 4.9. This indicator compares a closing price with its recent trading range, so such low readings show that Netflix ended near the bottom of that range. Yet the MACD remains negative at -2.502, below its -1.903 signal line, with a -0.598 histogram. That alignment indicates downward momentum remains in control rather than confirming a turn. [ GRAFIK-MOMENTUM ]Volatility & Volume
The average true range is $2.15, or 3.5% of the share price, indicating moderate day-to-day volatility. In practical terms, moves of a couple of dollars are consistent with recent trading conditions, so a small bounce would not alone overturn the broader pattern. Volume was 41,761,800 shares, around the 20-session average of 43,917,505. Trading was therefore close to normal rather than an exceptional surge that might signal a decisive change in participation. On-balance volume, which tracks whether volume accompanies rising or falling prices, is declining. That weakens the case for accumulation while the price remains under its moving averages.Key Levels & Scenarios
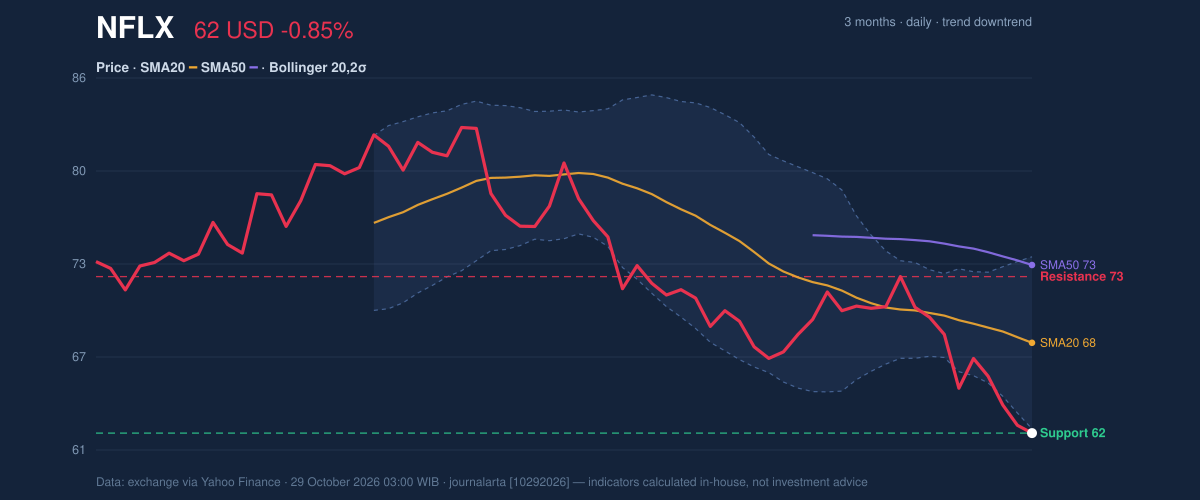
The immediate test is the $61.99 20-session support, with the three-month low at $61.51 nearby. A break below $61.51 would undermine the current support area and leave the chart without a lower supplied reference level. If the price holds that zone, the first substantial recovery hurdle is the lower-to-middle moving-average area: the 20-day average at $68.12, followed by resistance at $72.61. The 50-day average at $73.40 is a further barrier, not evidence of a reversal unless the price can reclaim it. The core signal is bearish, but oversold Stochastic readings and proximity to the three-month low make a support test more informative than chasing the trend alone.Technical Verdict: HOLD (wait & see)
The verdict reflects three indicators: price remains below falling SMA20 and SMA50, MACD is negative, and OBV is declining. Against that, the stock is at its 20-session low with oversold Stochastic readings, so the data show pressure and potential exhaustion without confirming a rebound. The verdict is invalidated if price falls below the supplied three-month low of $61.51.- Ideal Entry Range: $61.51–$62.28, anchored to the three-month low and lower Bollinger Band.
- Exit Target (Target Price): $68.12–$72.61, spanning the SMA20 and 20-session resistance.
- Stop Loss protection: Below $61.51, the supplied three-month low.
Summary Data NFLX
| Last price | 61.99 USD |
| Change 1 day / 5 days / 1 month | -0.85% / -4.69% / -10.91% |
| Trend / MA-cross | downtrend / none |
| SMA20 / SMA50 | 68.12 / 73.40 |
| RSI (14) / Stochastic %K | 30.3 / 4.2 |
| Bollinger %B / ATR | -2% / 2.15 |
| Support / Resistance 20 days | 61.99 / 72.61 |
| Data as of | 29 October 2026 03:00 WIB |
Disclaimer: This technical analysis is generated automatically from exchange data (via Yahoo Finance) and indicators calculated by JournalArta, for information and education only. The verdict and the entry, target and stop-loss levels are not investment advice or a solicitation to buy or sell any security. Investment decisions and their risks rest solely with the reader.
Track NFLX stock price daily: live levels, support/resistance and our full NFLX analysis history.