Death Cross Pressure, ICBC Stock Gains 1.48% on Friday
On October 30, 2026: price 7.90 HKD, trend sideways, RSI 62.8, support 7.24, resistance 7.89. technical analysis of icbc stock. Death Cross Pressure — full…
Why ICBC is in focus today
- Volume at 1.5× the 20-day average
- Closed at a 20-day high (7.89)
- Trading near its 3-month high (7.91)
- Fresh death cross: SMA20 crossed below SMA50
- Breaking out of a Bollinger squeeze (band width 7.5%)
Selected automatically from 16 HKEX (Hong Kong) stocks by a technical-signal score with daily weighted randomisation — not a recommendation.
Trend & Price Action
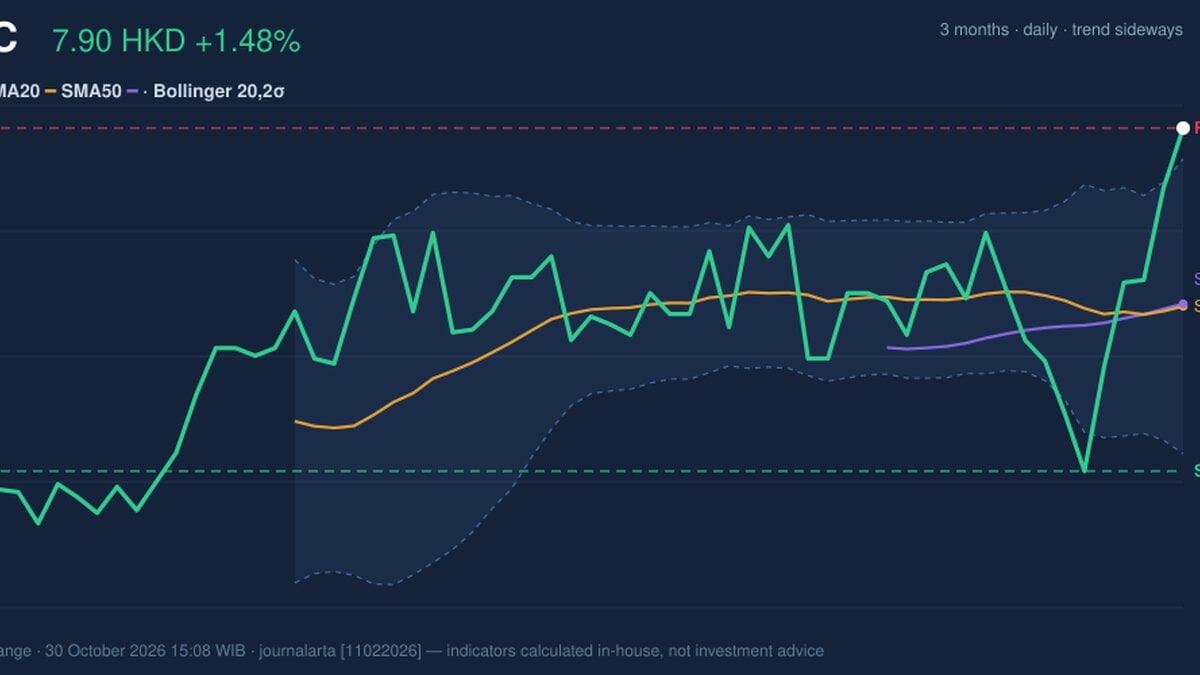
ICBC rose 1.48% in one day and 9.05% over five days, leaving it 2.40% higher over one month. The stock finished at the highest level of its 20-session range, with resistance at HK$7.89, and sat close to its three-month high of HK$7.91. The small gap between the close and that peak suggests buyers have driven price into a zone where further progress may require fresh demand. The technical backdrop is less decisive than the price move. At HK$7.90, the stock was above its 20-day simple moving average (SMA) of HK$7.55, but that average was marginally below the 50-day SMA of HK$7.56. The resulting death cross—formed two sessions before the latest session—is a bearish signal because it indicates the shorter-term average has slipped beneath the longer-term one. It is not, by itself, proof that the latest rally has failed: the 20-day average’s slope was nearly flat, rising just 0.05% over five days. As shown in the chart, price has moved above the upper Bollinger Band at HK$7.84. Bollinger Bands mark a range around a moving average; a close beyond the upper band can reflect strong buying, but it can also signal that price has stretched ahead of its recent norm. The band width was narrowing at 7.5%, a squeeze that can precede a larger move without indicating its direction.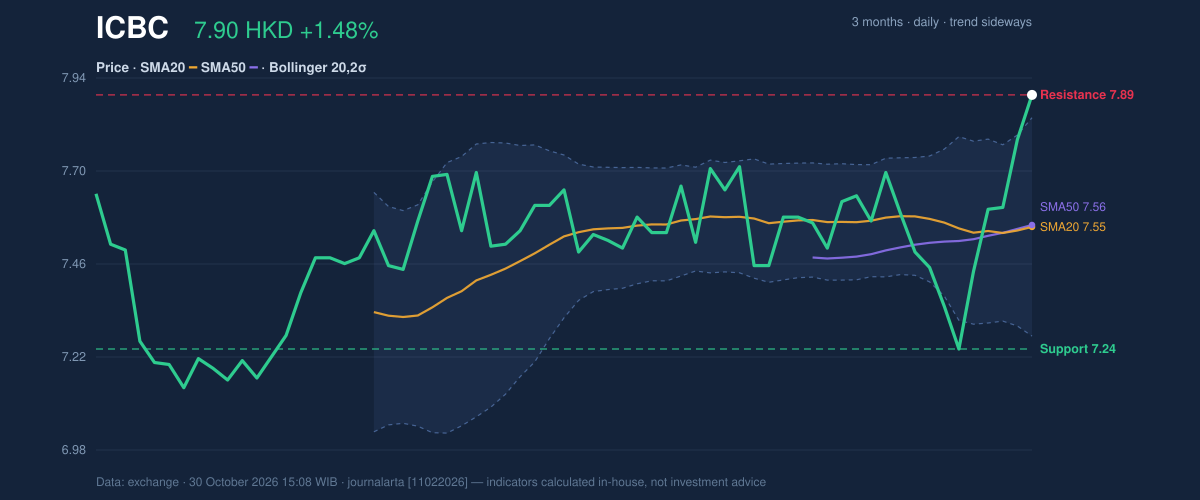
Oscillators & Momentum
Momentum measures are positive but not unanimous. The RSI was 62.8, a neutral reading: it reflects improving strength without reaching the commonly watched overbought threshold. MACD was also constructive, with the indicator at 0.034, above its -0.001 signal line, and a positive 0.035 histogram. In plain terms, the shorter-term momentum reading has turned upward. The caution comes from the Stochastic oscillator. Its %K at 97.3 and %D at 87.2 were overbought, meaning the recent advance has been rapid relative to the stock’s recent trading range. This condition can persist during a strong move, but it raises the chance of a pause or pullback—particularly with price at the top of its 20-session range and close to the three-month peak. As shown in the momentum chart, the combination of positive MACD and elevated Stochastic is a tension between direction and pace: upward momentum is present, but the move is already crowded by this measure.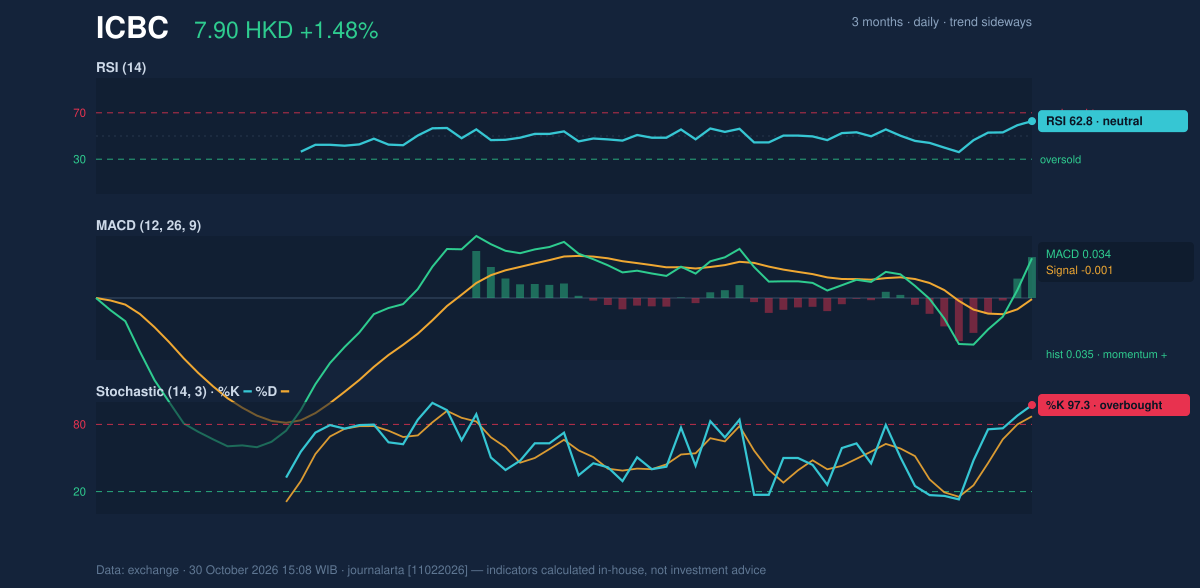
Volatility, Volume & Key Levels
Volume reached 291,692,718 shares, compared with a 20-session average of 188,244,848, while On-Balance Volume (OBV) was rising. The volume surge and rising OBV support the idea that more trading activity accompanied the advance, rather than the price rise occurring on declining participation. The 14-session Average True Range (ATR) was HK$0.20, or 2.5% of the share price, indicating moderate day-to-day movement—not a guarantee of the next session’s range. The immediate test is resistance at HK$7.89, with the three-month high at HK$7.91. A sustained move through that area would put the recent breakout attempt on firmer footing, though the overbought Stochastic argues against treating a brief push above it as confirmation. On the downside, support is HK$7.24, while the 20-day average at HK$7.55 and the Bollinger midpoint at HK$7.55 provide nearer reference points. Failure to hold those averages would weaken the short-term setup; a fall below HK$7.24 would breach the stated 20-session support.Technical Verdict: HOLD (wait & see)
HOLD (wait & see) is the clearest technical reading: the volume-backed rise, positive MACD and price above the 20-day average are offset by the recent death cross, overbought Stochastic and proximity to resistance. The squeeze and close above the upper Bollinger Band raise the prospect of a larger move, but do not establish its direction. - Ideal entry range: HK$7.55–HK$7.84, bounded by the 20-day average and upper Bollinger Band. - Exit target: HK$7.89–HK$7.91, using the 20-session resistance and three-month high. - Stop-loss protection: HK$7.24, the stated 20-session support. - Invalidation: This verdict is invalidated if price falls below HK$7.24. For non-traders, the signals show a strong recent rise, but the stock is close to a ceiling and has not yet resolved its mixed trend signals. | Indicator | Friday, October 30, 2026 | |---|---:| | Last price | HK$7.90 | | Change | 1 day: 1.48% · 5 days: 9.05% · 1 month: 2.40% | | SMA20 / SMA50 | HK$7.55 / HK$7.56 | | Death cross | Formed two sessions before the latest session | | Bollinger Bands | Upper HK$7.84 · Mid HK$7.55 · Lower HK$7.27 · Width 7.5% | | RSI / Stochastic | 62.8 neutral / %K 97.3, %D 87.2 overbought | | MACD / signal / histogram | 0.034 / -0.001 / 0.035 | | ATR(14) | HK$0.20 (2.5%) | | Volume / 20-session average | 291,692,718 / 188,244,848 | | OBV | Rising | | Support / resistance | HK$7.24 / HK$7.89 | | Three-month high / low | HK$7.91 / HK$7.09 |Summary Data ICBC
| Last price | 7.90 HKD |
| Change 1 day / 5 days / 1 month | 1.48% / 9.05% / 2.40% |
| Trend / MA-cross | sideways / death |
| SMA20 / SMA50 | 7.55 / 7.56 |
| RSI (14) / Stochastic %K | 62.8 / 97.3 |
| Bollinger %B / ATR | 110% / 0.20 |
| Support / Resistance 20 days | 7.24 / 7.89 |
| Data as of | 30 October 2026 15:08 WIB |
Disclaimer: This technical analysis is generated automatically from exchange data and indicators calculated by JournalArta, for information and education only. The verdict and the entry, target and stop-loss levels are not investment advice or a solicitation to buy or sell any security. Investment decisions and their risks rest solely with the reader.
Track ICBC share price daily: live levels, support/resistance and our full ICBC analysis history.