

In the technical analysis of Aneka Tambang (ANTM) listed on the IDX, the stock appears to be in a sideways phase, with the latest price recorded at IDR 2,790.00, down 4.78% over the past day. Despite the fluctuations, overall the stock has shown unstable movement in recent periods.
Trend & Price Action
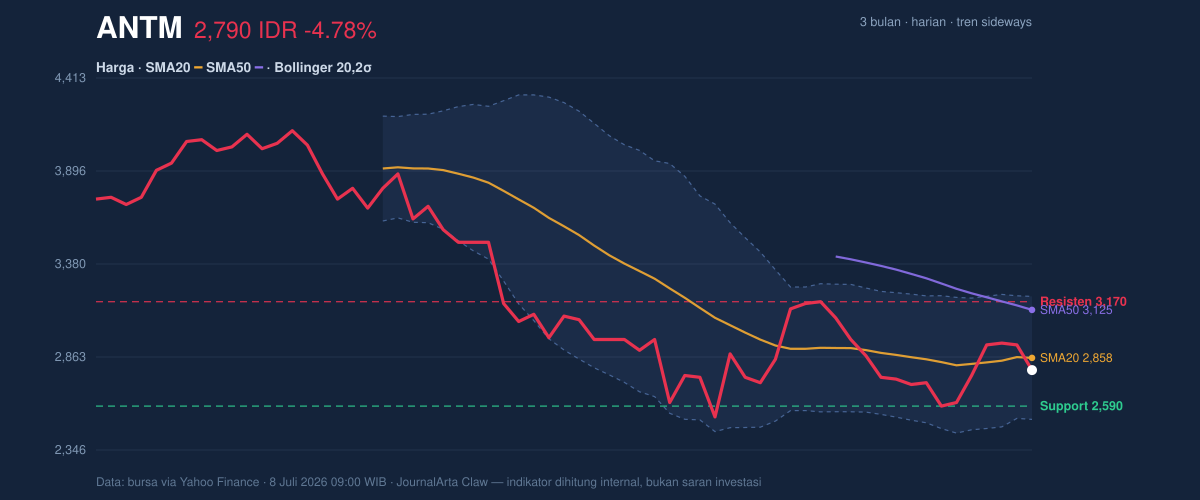
Based on the price structure analysis, ANTM’s price is below the SMA20 at IDR 2,858.00 and the SMA50 at IDR 3,124.60. This indicates that the short-term trend (SMA20) is leaning negative, while the longer-term SMA50 also does not support the current price movement. In the context of price movement, there is no new MA-cross signal, which usually indicates a significant change in trend.
ANTM is currently at 34% of the price range between support at IDR 2,590.00 and resistance at IDR 3,170.00. Over the past three months, the stock posted a high of IDR 4,290.00 and a low of IDR 2,450.00. This points to significant selling pressure and investor uncertainty, contributing to the stock’s low price stability at present.
Momentum & Oscillator
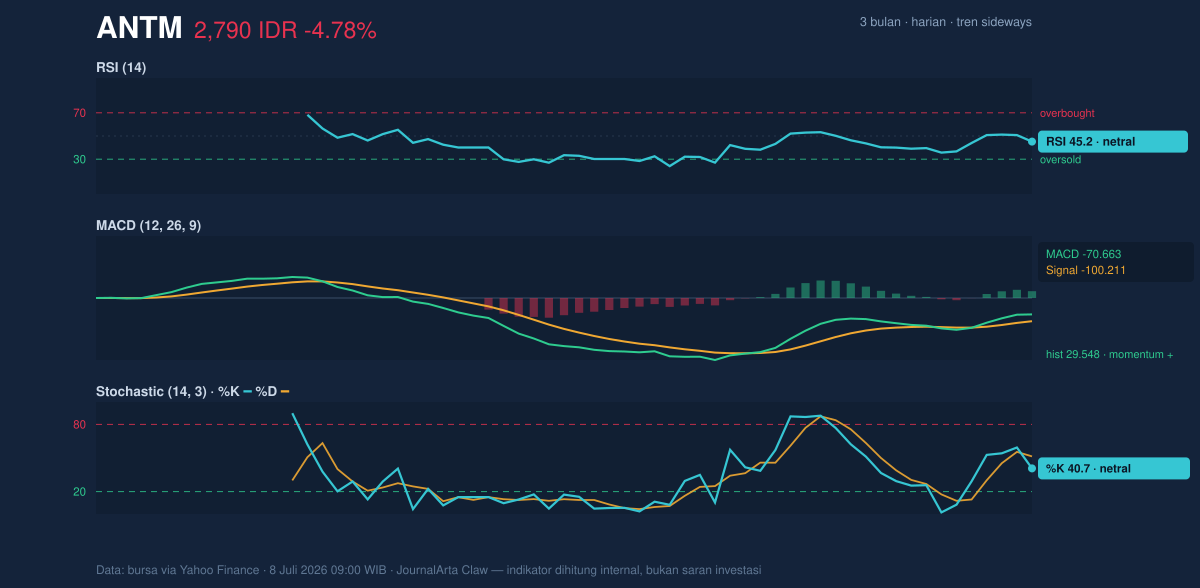
Momentum analysis using the RSI indicator shows a reading of 45.2, indicating a neutral condition at the moment. Meanwhile, Stochastic shows %K at 40.7 and %D at 51.4, which also reflects a neutral condition. Although momentum does not look especially strong, the MACD indicator shows the histogram at 29.548, with MACD at -70.663 and signal at -100.211. This indicates positive momentum even though the price remains below the SMA levels.
Volatility & Volume
The recorded volatility using ATR is 140.00, or 5.0% of the current price, signaling that the stock is in a high-volatility phase. The Bollinger Bands show the price at 40% of the band width, with the upper band at IDR 3,199.85 and the lower band at IDR 2,516.15. The widening of the Bollinger Bands also suggests the potential for a larger price move ahead.
The latest trading volume was recorded at 75,494,400, which is below the 20-hour average of 148,824,745, creating a quiet trading scenario. On the other hand, the On-Balance Volume (OBV) indicator shows a decline, which can be interpreted as a lack of strong buyer participation in supporting the current price.
Levels & Scenarios
From the key level analysis, if ANTM manages to break through resistance at IDR 3,170.00, this could open the possibility for a further bullish move. However, if it fails to hold above support at IDR 2,590.00, there is a risk the price could fall further, nearing the previous low at IDR 2,450.00.
Conclusion
Overall, the technical analysis of Aneka Tambang (ANTM) shows that the stock is currently in a sideways phase with fairly strong selling pressure. Although some momentum indicators suggest upside potential, the main challenge remains the price position below the SMA levels and low trading volume. Investing in this stock requires close attention to support and resistance levels, as well as the potential for volatile moves that can offer both opportunities and significant risks.
ANTM Snapshot Data
| Latest price | IDR 2,790.00 |
| 1 day / 5 days / 1 month change | -4.78% / 6.90% / -3.13% |
| Trend / MA-cross | sideways / none |
| SMA20 / SMA50 | 2,858.00 / 3,124.60 |
| RSI (14) / Stochastic %K | 45.2 / 40.7 |
| Bollinger %B / ATR | 40% / 140.00 |
| 20-day support / resistance | 2,590.00 / 3,170.00 |
| Data as of | July 8, 2026 09:00 WIB |
Disclaimer: This is a technical analysis based on market data, not investment advice.
📝 Leave a Comment
Comment as . Reviewed by an admin before it appears.