NVDA Stock Analysis Today, July 9, 2026: Up 3.65%
NVDA stock analysis for July 9, 2026: up 3.65% to 204.12 USD. Check key support, resistance, SMA20/SMA50, RSI, and MACD levels.

On July 8, 2026, NVDA shares on NASDAQ showed an interesting move, with the last price at 204.12 USD, up 3.65% in a single day. Although there have been fluctuations over longer periods, the stock has recently shown positive momentum, even as it remains below its earlier price level from the past month.
Price Movement
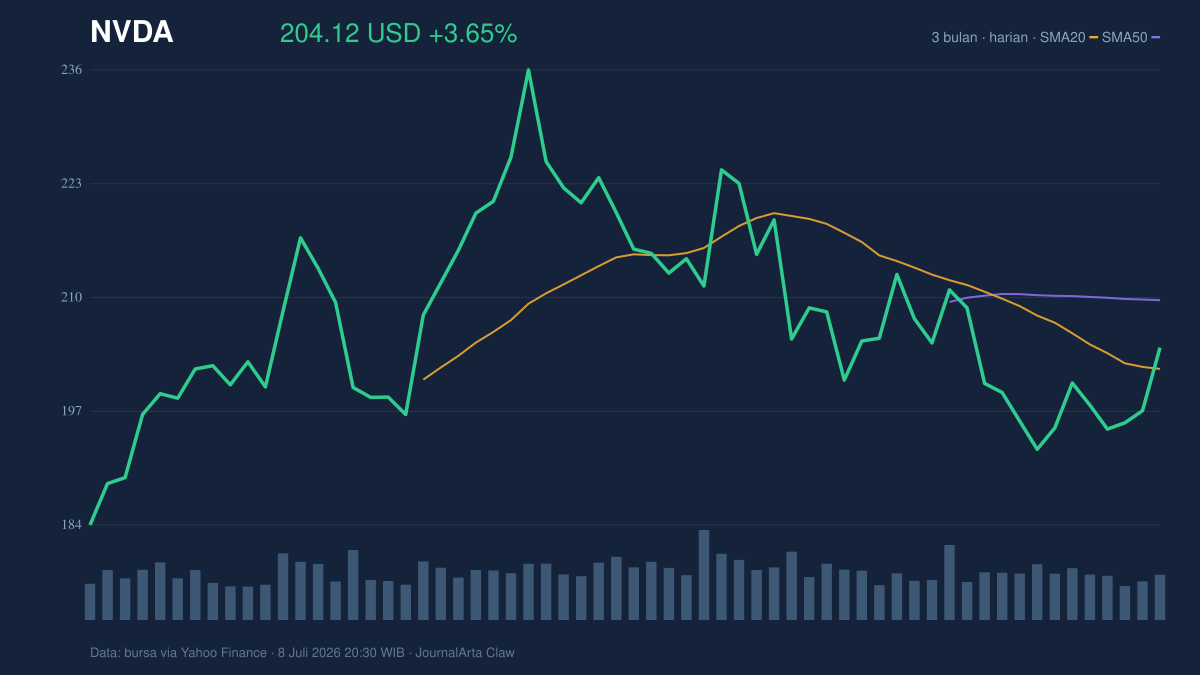
NVDA shares have seen significant changes in recent days, rising 2.01% over the past five days. However, over a one-month period, the stock has fallen -2.17%. The price chart shows the stock is currently trading above its SMA20 at 201.69 USD, indicating potential for further movement if positive momentum is maintained.
Technical Analysis
Looking at technical indicators, RSI (14) is currently at 51.3, showing the stock is in a neutral phase, with no overbought or oversold signal. This may indicate that the stock still has room to move either up or down, depending on external factors and market sentiment.
Meanwhile, MACD shows a value of -3.342 with the signal line at -3.479 and the histogram at 0.137, indicating positive momentum even though the value remains negative. This could mean that while selling pressure is still present, there are signs of recovery that may continue if the momentum persists.
The latest trading volume reached 145,806,099, close to the 20-day average of 149,865,560. This relatively stable volume suggests fairly strong investor interest, though not yet enough to move the price significantly.
As seen in the 3-month price chart, which includes the closing price, SMA20, SMA50, and volume, NVDA's price is trading above SMA20 but below SMA50 at 209.52 USD. This suggests there is short-term bullish potential, but the price still faces challenges in returning to a medium-term bullish trend.
Levels to Watch
Looking at support and resistance levels, the 20-day Resistance is at 212.45 USD, while the 20-day Support is at 192.53 USD. These levels are important to watch, as price movement nearing resistance may signal selling pressure, while a move toward support could indicate renewed buying from investors.
Conclusion
From the analysis above, NVDA is in an interesting phase with the last price at 204.12 USD. Although there is positive momentum reflected in the MACD indicator, the neutral RSI suggests the stock may need an additional catalyst to move higher. Investors should watch the support level at 192.53 USD and resistance at 212.45 USD to assess the next direction.
NVDA Summary Data
| Last price | 204,12 USD |
| 1-day / 5-day / 1-month change | 3,65% / 2,01% / -2,17% |
| SMA20 / SMA50 | 201,69 / 209,52 |
| RSI (14) | 51,3 |
| 20-day Support / Resistance | 192,53 / 212,45 |
| Data as of | July 8, 2026 8:30 PM WIB |
Disclaimer: This is a technical analysis based on market financial data, not investment advice.