BRIS Share Price Today (IDX: BRIS)
Bank Syariah Indonesia · Indonesia Stock Exchange · Data as of 2 Oktober 2026 09:00 WIB
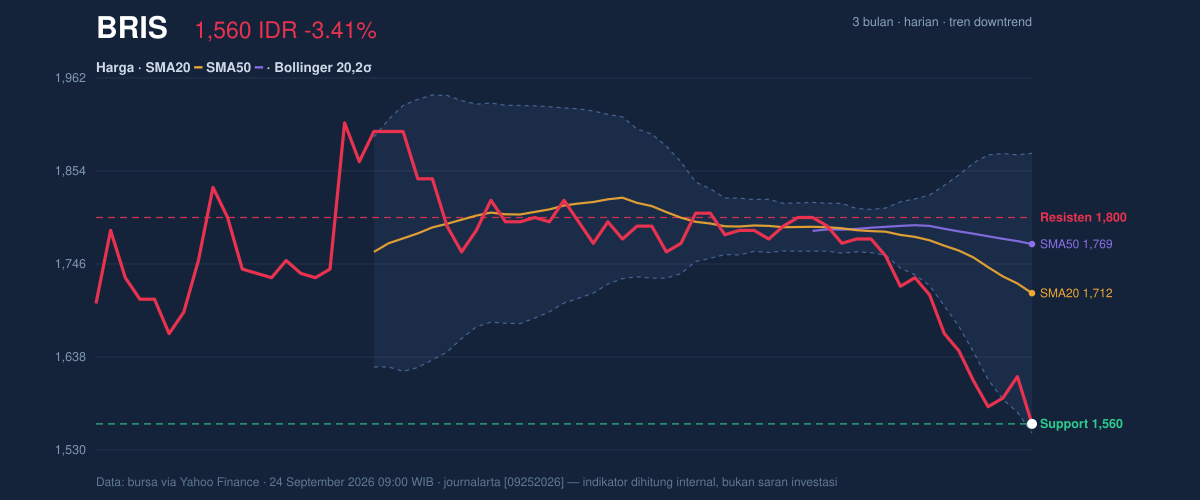
Latest analysis: Teknikal Saham BRIS Hari Ini: Melemah 3.41%, RSI Jenuh Jual (2026-10-02)
Quick answers
What is the BRIS share price today?
Bank Syariah Indonesia (IDX: BRIS) last traded at 1,415 IDR, a change of -0.70% from the previous close. Data as of 2 Oktober 2026 09:00 WIB.
Is BRIS stock in an uptrend or downtrend?
Based on the 20- and 50-day moving averages, BRIS is currently in a downtrend (price below SMA20 and SMA50). The 14-day RSI is 18.1 (oversold territory).
What are the key support and resistance levels for BRIS?
Over the last 20 trading days the support level is around 1,415 IDR and resistance is around 1,775 IDR. The 3-month range is 1,385 to 1,945 IDR.
How often is this BRIS page updated?
Prices and indicators refresh throughout trading days from exchange data, and a new technical analysis article is published on most trading days. This page is information, not investment advice.
BRIS analysis history
- Teknikal Saham BRIS Hari Ini: Melemah 3.41%, RSI Jenuh Jual 2026-10-02 · ID
- Saham BRIS Menguat 0.63%, RSI Jenuh Jual Jadi Sorotan 2026-09-29 · ID
- Saham BRIS Menguat 0.63%, RSI Jenuh Jual Jadi Sorotan 2026-09-28 · ID
- Saham BRIS Melemah 2.63%, RSI Jenuh Jual Jadi Sorotan 2026-09-22 · ID
- Saham BRIS Melemah 2.63%, RSI Jenuh Jual Jadi Sorotan 2026-09-21 · ID
- BRIS Uji Resistance Kunci: Saham Menguat 0.56% (3 September 2026) 2026-09-03 · ID
- Saham BRIS Menguat 1.98%, Momentum Melemah Jadi Sorotan 2026-08-24 · ID
- Golden Cross Terbentuk, Saham BRIS Menguat 1.41% Hari Ini 2026-08-13 · ID
- Saham BRIS Menguat 1.96% Hari Ini, Momentum Melemah 2026-08-03 · ID
- Saham BRIS Menguat 1.88% Hari Ini, Uji Resistance Kunci 2026-07-22 · ID
Prices and indicators are derived from exchange data via Yahoo Finance and may be delayed. This page is technical information, not investment advice. · Versi Bahasa Indonesia