JournalArta
Wednesday, November 11, 2026 · JakartaS&P 7,625.88 ▲1.40%USD/IDR 18,186 ▼0.03%
JournalArta
Global Edition
beyond headlines
S&P 5007,625.88▲1.40%
Nasdaq25,505.31▲1.75%
Dow Jones52,488.68▲0.49%
FTSE 10010,835.47▲0.78%
DAX26,662.77▲1.20%
Euro STOXX 506,393.39▲1.04%
Nikkei 22561,249▲1.31%
Hang Seng24,316▼0.54%
IHSG5,115.04▼0.21%
USD/IDR18,186▼0.03%
EUR/USD1.1095▼0.65%
USD/JPY159.84▲0.72%
GBP/USD1.3277▼0.52%
USD/CNY6.6631▼0.08%
AUD/USD0.6852▼0.28%
USD/SGD1.2847▲0.27%
Brent$92.46▲1.06%
WTI$86.30▲0.30%
Gold$3,986.62▼0.01%
Silver$51.83▲1.17%
BTC$74,446▲1.00%
ETH$2,078▲1.35%
NVDA$168.89▼5.47%
S&P 5007,625.88▲1.40%
Nasdaq25,505.31▲1.75%
Dow Jones52,488.68▲0.49%
FTSE 10010,835.47▲0.78%
DAX26,662.77▲1.20%
Euro STOXX 506,393.39▲1.04%
Nikkei 22561,249▲1.31%
Hang Seng24,316▼0.54%
IHSG5,115.04▼0.21%
USD/IDR18,186▼0.03%
EUR/USD1.1095▼0.65%
USD/JPY159.84▲0.72%
GBP/USD1.3277▼0.52%
USD/CNY6.6631▼0.08%
AUD/USD0.6852▼0.28%
USD/SGD1.2847▲0.27%
Brent$92.46▲1.06%
WTI$86.30▲0.30%
Gold$3,986.62▼0.01%
Silver$51.83▲1.17%
BTC$74,446▲1.00%
ETH$2,078▲1.35%
NVDA$168.89▼5.47%
Advertisement
Markets › Stocks › ASX

Westpac Share Price Today (ASX: WBC.AX)

Westpac Banking Corporation · Australian Securities Exchange · Data as of 11 November 2026 12:10 WIB
37.29 AUD
▲ +0.00%
5d +1.77% · 1mo +4.42%
Trend / MA-crossuptrend / none
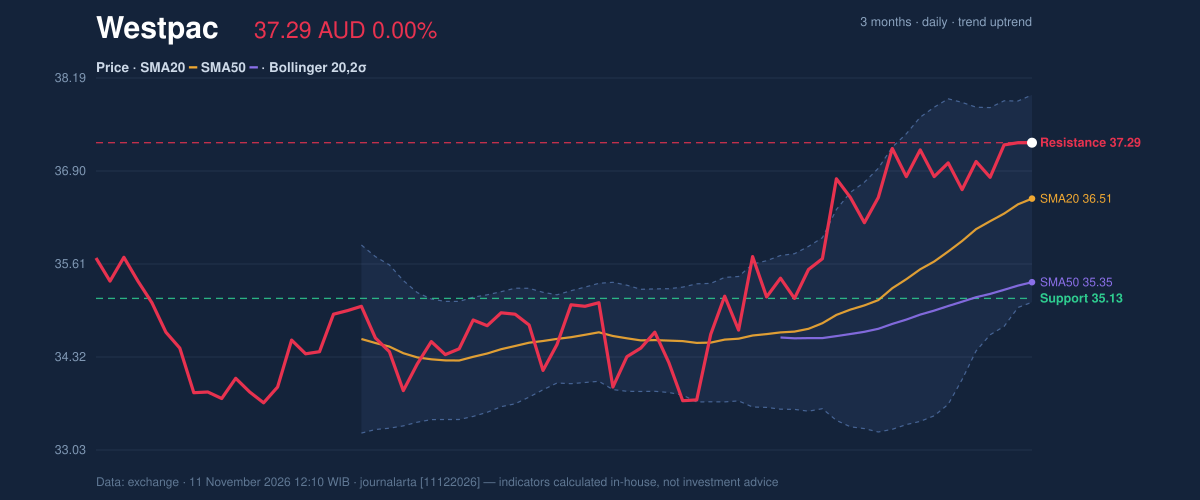
SMA20 / SMA5036.52 / 35.35
RSI (14) / Stoch %K61.3 / 78.7
Bollinger %B / ATR(14)77% / 0.83
Support / Resistance (20d)35.13 / 37.29
3-month low / high33.46 / 37.71
Advertisement
Westpac price action chart
Westpac 3-month price action from our latest analysis: price, SMA20/50, Bollinger bands, support and resistance.

Latest analysis: Westpac Share Price Falls 0.00% (November 11, 2026): Testing Key Resistance (2026-11-12)

Quick answers

What is the Westpac share price today?

Westpac Banking Corporation (ASX: WBC.AX) last traded at 37.29 AUD, a change of 0.00% from the previous close. Data as of 11 November 2026 12:10 WIB.

Is Westpac stock in an uptrend or downtrend?

Based on the 20- and 50-day moving averages, Westpac is currently in an uptrend (price above SMA20 and SMA50). The 14-day RSI is 61.3 (neutral range).

What are the key support and resistance levels for Westpac?

Over the last 20 trading days the support level is around 35.13 AUD and resistance is around 37.29 AUD. The 3-month range is 33.46 to 37.71 AUD.

How often is this Westpac page updated?

Prices and indicators refresh throughout trading days from exchange data, and a new technical analysis article is published on most trading days. This page is information, not investment advice.

Advertisement

Westpac analysis history

Prices and indicators are derived from exchange data and may be delayed. This page is technical information, not investment advice. · Versi Bahasa Indonesia