Alibaba Stock Analysis: Drops 3.68%, Momentum Gains
On Juli 20, 2026: price 112.60 HKD, trend sideways, RSI 55.9, support 89.50, resistance 116.90. technical analysis of alibaba stock. Alibaba Stock Analysis —…
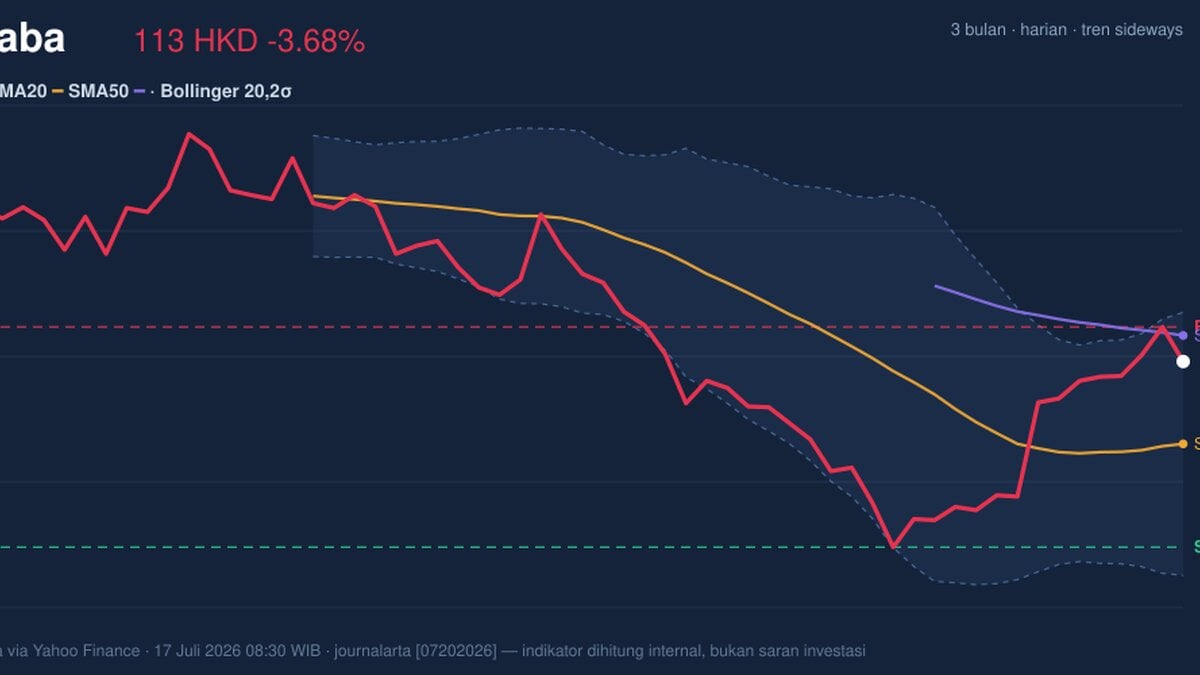
Alibaba Group shares on the Hong Kong Stock Exchange fell 3.68% to 112.60 HKD in the latest session, retreating sharply from a previous close of 116.90 — a level that, according to exchange data via Yahoo Finance as of 17 July 2026, doubles as the stock's 20-day resistance. The pullback trims a recovery that still leaves the stock up 2.18% over five days and 5.33% over one month. The story here is not the drop itself, but where it happened: Alibaba ran into the ceiling of its recent range and was turned away.
Trend & Price Action
The broader trend remains officially sideways, but the internal structure is quietly improving. Price sits above the SMA20 at 102.35, and that average is now sloping upward at 1.17% per five days — the short-term trend is recovering. The complication is the SMA50 at 115.84, which still sits above both the price and the SMA20. That ordering is the legacy of an earlier death cross, when the short average fell below the long one, and no fresh crossover has occurred to repair it. In plain terms: the recovery is real but unfinished, and the market just confirmed that by rejecting the stock almost exactly at the 115.84–116.90 zone where the SMA50 meets range resistance.
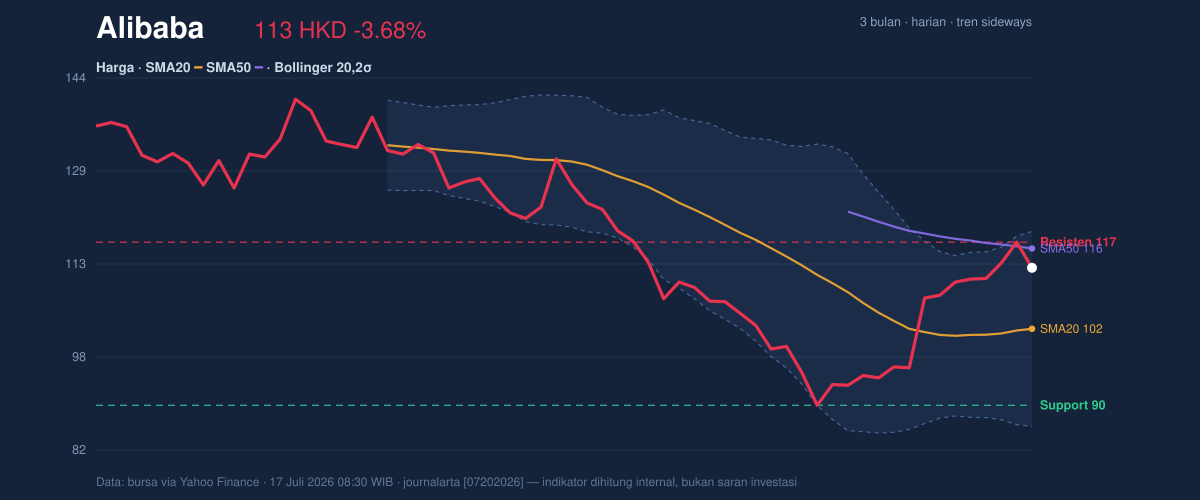
Price now sits at 84% of its 20-day range, with the three-month extremes at 144.00 and 88.65 — a wide corridor that shows how much ground remains contested.
Momentum & Oscillators
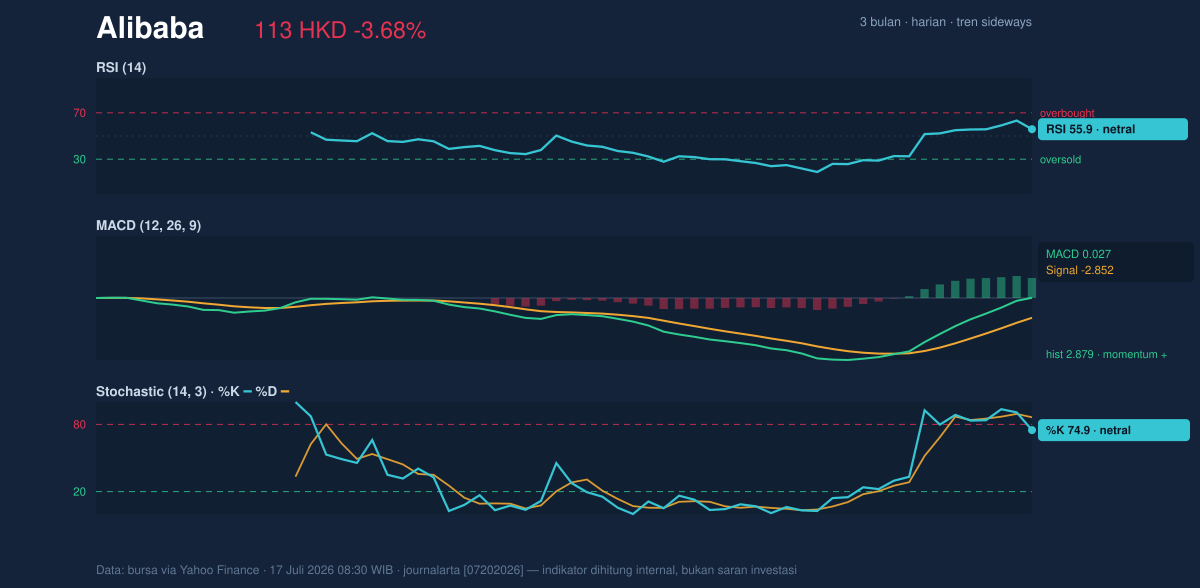
Momentum is sending two messages at once, and the tension matters. The MACD at 0.027 versus a signal line of -2.852 produces a positive histogram of 2.879, meaning medium-term momentum has swung decisively upward — this is the engine behind the month's 5.33% gain. The RSI at 55.9 is neutral, confirming the rally is not stretched.
The Stochastic tells the shorter-term story: %K at 74.9 has crossed below %D at 86.4, a bearish crossover in the upper reaches of the range. That is momentum cooling precisely as price hit resistance — the oscillator equivalent of a runner slowing before a wall.
Volatility & Volume
The Bollinger Bands are expanding, with width at 32.0%, and price is riding high with a %B of 81% — close to, but not at, the upper band of 118.70. Expanding bands mean volatility is rising, so expect larger daily moves in both directions rather than a calm drift. The ATR of 5.66, roughly 5.0% of the share price, quantifies that: this is a stock that can travel fast.
Volume, however, softens the bearish read on the down day. The 3.68% decline came on 125.6 million shares, just 1.0× the 20-day average — no selling stampede — while OBV continues to rise, indicating cumulative buying pressure remains intact. This looks like supply at resistance, not distribution.
Key Levels & Scenarios
The map is clean. Resistance: 116.90, then the upper Bollinger band at 118.70. A decisive close above that zone would clear both the range top and the band, opening the path toward the three-month high at 144.00. Support: the SMA20 at 102.35 — which coincides with the Bollinger mid-band — then 89.50 and the three-month low at 88.65. Losing 102.35 would break the rising short-term trend; losing 89.50 would break the recovery itself.
Technical Verdict: HOLD
HOLD (wait & see) — the indicators argue for patience, not action.
- Positive momentum is building but unconfirmed: MACD histogram at +2.879 and price above a rising SMA20 favour the bulls, yet price remains capped below the SMA50 at 115.84.
- The Stochastic bearish cross (%K 74.9 below %D 86.4) at the top of the range warns the immediate push has stalled — exactly what the rejection at 116.90 confirms.
- Rising OBV on an average-volume down day means sellers have not taken control, so the recovery thesis survives.
- Invalidation: the verdict flips negative if price falls below 102.35; a break below 89.50 would signal deeper deterioration.
Levels derived strictly from the data:
- Entry Range: pullback entries toward the 102.35 SMA20/mid-band zone; momentum entries only on a confirmed close above 116.90.
- Exit Target: 116.90 first, 118.70 second, with 144.00 as the extended objective.
- Stop Loss: below 102.35 for tactical positions; below 89.50 for structural protection.
For non-traders: the stock is climbing but keeps hitting a ceiling just above its current price — the sensible stance is to wait until it either breaks through 116.90 or pulls back to stronger support. Alibaba has now been rejected at exactly 116.90, the same price as its previous close.
Summary Data Alibaba
| Last price | 112.60 HKD |
| Change 1 day / 5 days / 1 month | -3.68% / 2.18% / 5.33% |
| Trend / MA-cross | sideways / none |
| SMA20 / SMA50 | 102.35 / 115.84 |
| RSI (14) / Stochastic %K | 55.9 / 74.9 |
| Bollinger %B / ATR | 81% / 5.66 |
| Support / Resistance 20 days | 89.50 / 116.90 |
| Data as of | 17 Juli 2026 08:30 WIB |
Track Alibaba share price daily: live levels, support/resistance and our full Alibaba analysis history.