AMD Stock Drops 1.03% Today, Testing Support Level
On Juli 20, 2026: price 495.76 USD, trend sideways, RSI 46.3, support 495.76, resistance 580.91. technical analysis of amd stock. AMD Stock Drops — full…

For global investors trying to gauge whether the AI-chip trade still has legs, Advanced Micro Devices just offered an uncomfortable data point: the stock closed Friday at $495.76, down 1.03% on the day and a bruising -11.14% over five sessions, according to exchange data via Yahoo Finance as of 17 July 2026. The one-month picture is milder at -3.26%, which tells you the damage is recent, fast, and still unresolved. This is no longer a story about how far AMD has run — it is a story about whether the floor beneath it holds.
Trend & Price Action
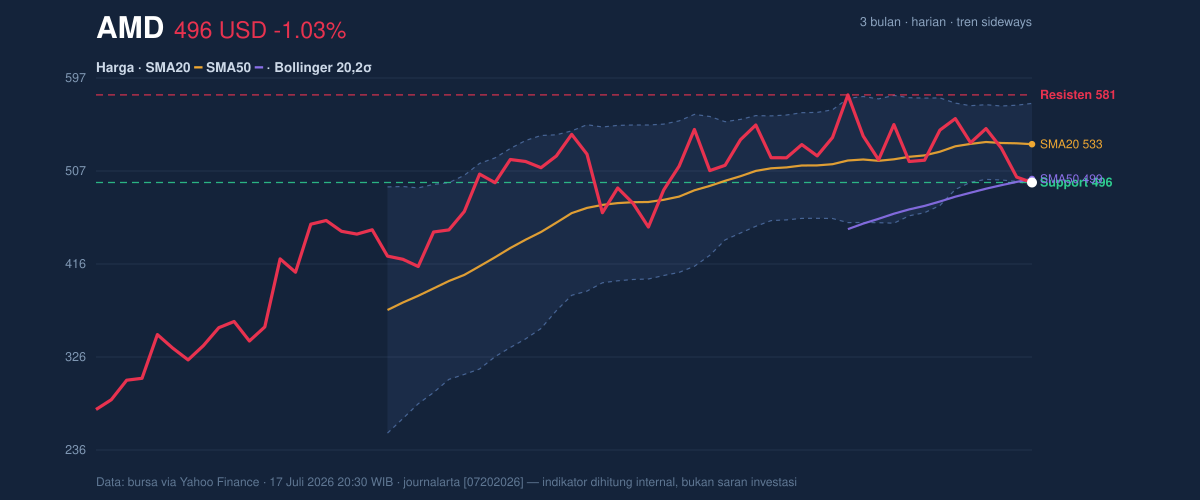
The tape has shifted from rally mode to repair mode. AMD now trades below its 20-day moving average at 533.02 and has also slipped a fraction under the 50-day line at 499.08 — a level it needs to reclaim quickly to avoid a deeper reset. There is no new moving-average crossover, and the SMA20's slope of just 0.39% over five days officially classifies the trend as sideways, but sideways trends sitting on their lows are rarely neutral in practice.
The more striking detail is where the price sits inside its own structure. AMD is at 0% of its 20-day range, meaning the last trade and the 20-day support are the same number: 495.76. The Bollinger %B reading of 3% confirms the stock is hugging the lower band at 493.43. Context matters here: the three-month high and low stand at 584.73 and 272.00, so even after this slide, the stock remains far above its spring trough. What is being tested now is not the long-term story — it is the near-term conviction of buyers.
Momentum & Oscillators
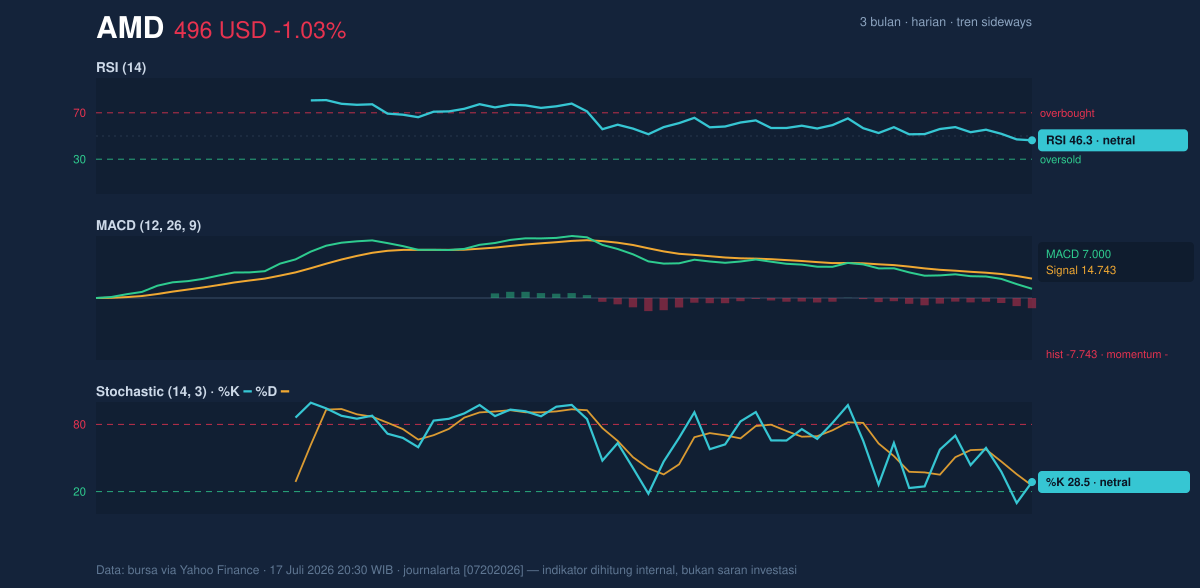
Momentum indicators paint a picture of sellers in control, but running low on fresh ammunition. The RSI at 46.3 is neutral — notably, not oversold — which means the decline has been orderly rather than capitulative, and there is technically room for it to extend. The Stochastic tells a subtler story: %K at 28.5 has crossed just above %D at 25.4 in the lower quadrant, a small early hint that selling pressure may be easing, though not yet a signal anyone should hang a decision on.
The MACD is the clearest negative on the board: the line at 7.000 sits below its signal at 14.743, leaving a histogram of -7.743. Momentum, in plain terms, is still pointing down. The one consolation for bulls is that the MACD line itself remains above zero — the medium-term trend baseline has not fully rolled over.
Volatility & Volume
Anyone trading this name should understand what a normal day now looks like. The ATR of 40.70 — roughly 8.2% of the share price — is exceptionally high; a $40 swing in either direction is an ordinary session, not a shock. Bollinger band width at 14.9% is within normal bounds, so there is no squeeze building up energy, but also no calm.
Volume behaviour leans defensive. Friday's 32.07 million shares changed hands at 1.1 times the 20-day average, and On-Balance Volume is falling — meaning the selling has participation behind it. This is distribution, not drift.
Key Levels & Scenarios
The battleground is tight and well-defined. Support sits at 495.76, reinforced by the lower Bollinger band at 493.43. Overhead, resistance layers up quickly: the SMA50 at 499.08, the SMA20 at 533.02, and the 20-day ceiling at 580.91.
If buyers defend the 493–496 zone and the price reclaims 499, a mean-reversion bounce toward 533 becomes the base case. If 493.43 gives way on volume, with an ATR this large, the decline could accelerate before the next logical floor emerges.
Technical Verdict: HOLD
The indicators argue for HOLD (wait & see) rather than action in either direction:
1. MACD histogram at -7.743 with price below both key moving averages — momentum is still against buyers.
2. Price pinned exactly at support with %B at 3% and Stochastic near oversold — chasing the fall here is as risky as front-running a bounce that hasn't confirmed.
3. Falling OBV on above-average volume signals genuine distribution, not seller exhaustion.
Verdict invalidated if the price breaks decisively below 493.43.
- Entry Range: 493–500, only if support holds and the price reclaims the SMA50 at 499.08
- Exit Target (Target Price): 533.02 (SMA20); stretch target 580.91 (20-day resistance)
- Stop Loss: below 493.43 (lower Bollinger band)
In plain English: the chart says sit on your hands and let the 493–496 floor prove itself before doing anything.
This is technical analysis based on exchange data, not an investment recommendation; site disclaimer applies. As one semiconductor desk strategist put it after Friday's close: "Everyone wants to know if the AI trade is dead — right now the chart is just asking you to wait for the answer."
Summary Data AMD
| Last price | 495.76 USD |
| Change 1 day / 5 days / 1 month | -1.03% / -11.14% / -3.26% |
| Trend / MA-cross | sideways / none |
| SMA20 / SMA50 | 533.02 / 499.08 |
| RSI (14) / Stochastic %K | 46.3 / 28.5 |
| Bollinger %B / ATR | 3% / 40.70 |
| Support / Resistance 20 days | 495.76 / 580.91 |
| Data as of | 17 Juli 2026 20:30 WIB |


