MRK Stock Drops 0.10%, Momentum Weakens In Focus
On Juli 20, 2026: price 127.50 USD, trend uptrend, RSI 57.7, support 113.87, resistance 129.56. technical analysis of mrk stock. MRK Stock Drops — full details…

For international investors who treat big pharma as a defensive anchor, Merck's quiet rally is now approaching its first serious test. Merck & Co. (NYSE: MRK) closed at $127.50 on 17 July 2026, down a marginal 0.10% on the day but still sitting on a +10.45% gain over the past month and a 3.21% rise over five sessions, according to exchange data via Yahoo Finance. The bigger story is where that price now sits: directly beneath a resistance ceiling, with trend indicators pointing up and momentum indicators quietly tapping the brake.
Trend & Price Action
The trend structure remains unambiguously bullish. MRK trades above its 20-day simple moving average at $124.51, and that average itself is climbing at roughly 1.56% every five days — a healthy, sustainable slope rather than a blow-off spike. The 50-day average at $119.52 sits well below, and with no fresh moving-average crossover on the chart, the signal is one of a mature, established uptrend rather than a new breakout. Maturity cuts both ways: trends this developed often pause at well-watched ceilings.
That ceiling is now in plain sight. The price sits at 87% of its 20-day range, pressing against resistance at $129.56, with the three-month high of $131.74 just beyond. The three-month low of $107.90 is distant history after this run.
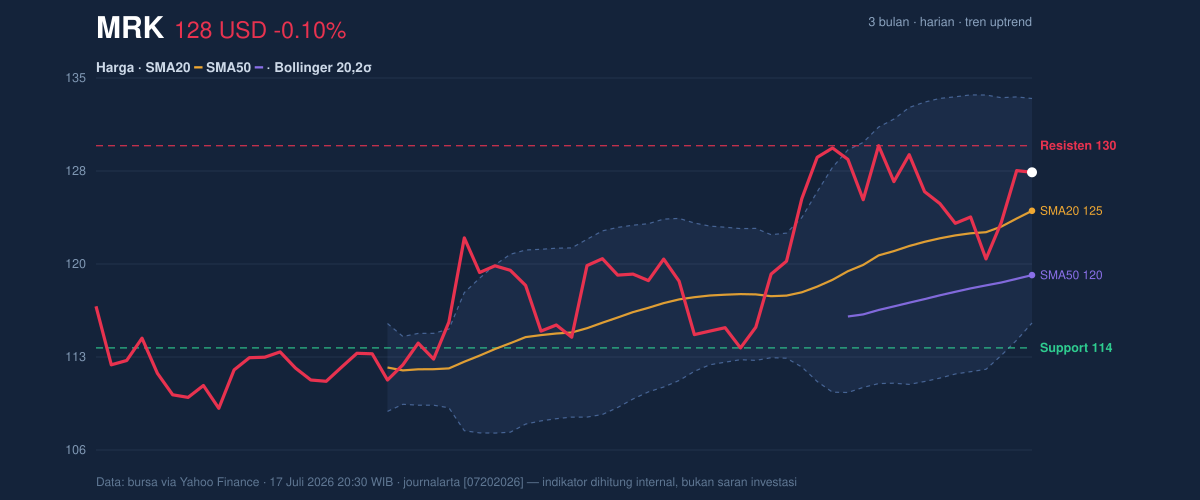
The trend is up. The open question is whether buyers have the fuel to punch through.
Momentum & Oscillators
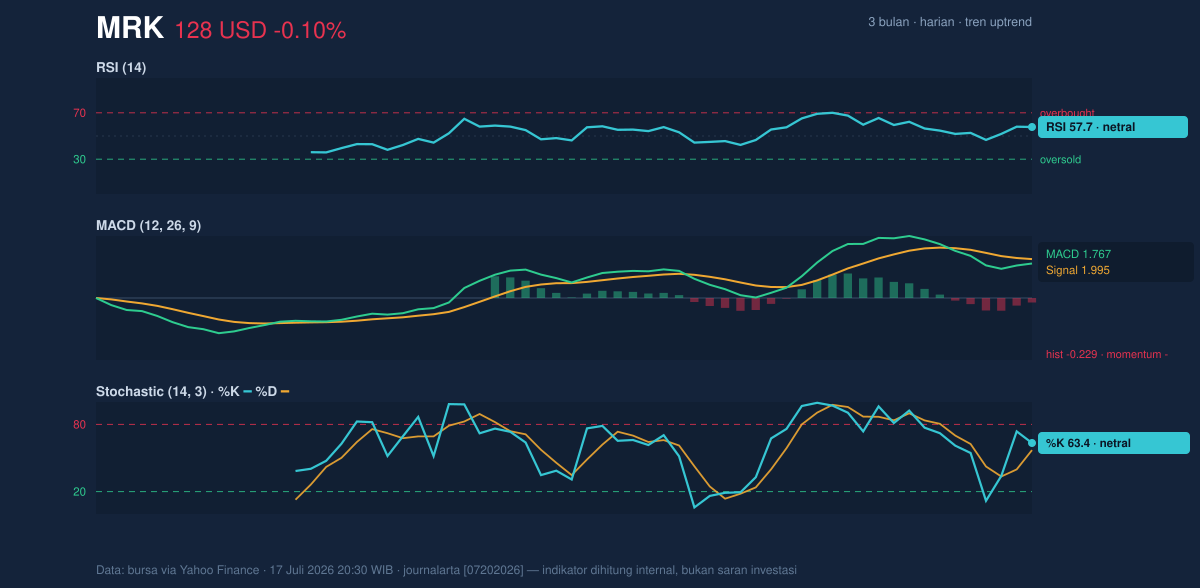
This is where the picture gets more nuanced. The RSI at 57.7 is neutral — the Relative Strength Index measures the speed of recent gains versus losses on a 0–100 scale, and readings near 70 signal overbought conditions. MRK is nowhere near that, which means the rally is not technically exhausted. The Stochastic oscillator tells a similar story, with %K at 63.4 above %D at 57.1, a mildly positive short-term alignment.
The MACD, however, disagrees. The MACD line — which compares short-term momentum to medium-term momentum — stands at 1.767, below its signal line at 1.995, producing a negative histogram of -0.229. In plain terms: the engine of this rally is losing revs even as the car keeps rolling forward. After a double-digit monthly gain, that is a classic early warning of consolidation, not necessarily reversal — but it argues against chasing the price here.
Volatility & Volume
The Bollinger Bands — volatility envelopes drawn two standard deviations around the 20-day average — show a %B reading of 67%, meaning the price sits in the upper half of its normal range but well short of the upper band at $133.22. Band width is 14.0%, a normal reading: no squeeze signaling an imminent explosive move, and no expansion signaling panic. The Average True Range of $3.76, or 2.9% of the price, confirms moderate daily volatility — traders should expect swings of that size as routine.
Volume adds the most important caveat. The latest session's 13.47 million shares ran at 1.2× the 20-day average of 11.38 million, yet On-Balance Volume is falling. OBV accumulates volume on up days and subtracts it on down days; a declining OBV alongside rising prices is a divergence suggesting institutional accumulation is not confirming this advance.
Key Levels & Scenarios
The conditional map is clean. If MRK closes decisively above $129.56 with volume confirmation, the path opens toward $131.74 and then the upper Bollinger band at $133.22. If it fails to hold the 20-day average at $124.51, expect a drift toward the 50-day average at $119.52, with the 20-day support shelf at $113.87 as the deeper floor.
Technical Verdict: HOLD
HOLD (wait & see) — the trend rewards patience, not pursuit, at current levels.
- Reason 1: Price is pinned at 87% of its range directly under $129.56 resistance, while the MACD histogram at -0.229 shows momentum fading — poor reward-to-risk for fresh entries at the ceiling.
- Reason 2: OBV is falling despite above-average volume, meaning the rally lacks confirmed institutional participation.
- Reason 3: The rising SMA20 at $124.51 offers a nearby, logical pullback zone where trend and support align.
Invalidation: the cautious stance flips constructive on a confirmed close above $129.56; the bullish structure is damaged on a close below $124.51.
- Entry Range: $124.50–$125.00 on a pullback toward the 20-day average, or on a confirmed breakout above $129.56
- Exit Target: $131.74 (three-month high), then $133.22 (upper Bollinger band)
- Stop Loss: below $119.52 (50-day average); a tighter alternative sits just under $124.51
In plain English: Merck is in a solid uptrend but catching its breath right under a ceiling — the next session's test of $129.56 will say more than the last month's gains. This is technical analysis, not an investment recommendation; site disclaimer applies.
Summary Data MRK
| Last price | 127.50 USD |
| Change 1 day / 5 days / 1 month | -0.10% / 3.21% / 10.45% |
| Trend / MA-cross | uptrend / none |
| SMA20 / SMA50 | 124.51 / 119.52 |
| RSI (14) / Stochastic %K | 57.7 / 63.4 |
| Bollinger %B / ATR | 67% / 3.76 |
| Support / Resistance 20 days | 113.87 / 129.56 |
| Data as of | 17 Juli 2026 20:30 WIB |

