NKE Stock Gains 1.39%, Momentum Weakens In Focus
On September 4, 2026: price 38.77 USD, trend downtrend, RSI 41.8, support 38.12, resistance 42.11. technical analysis of nke stock. NKE Stock Gains — full…
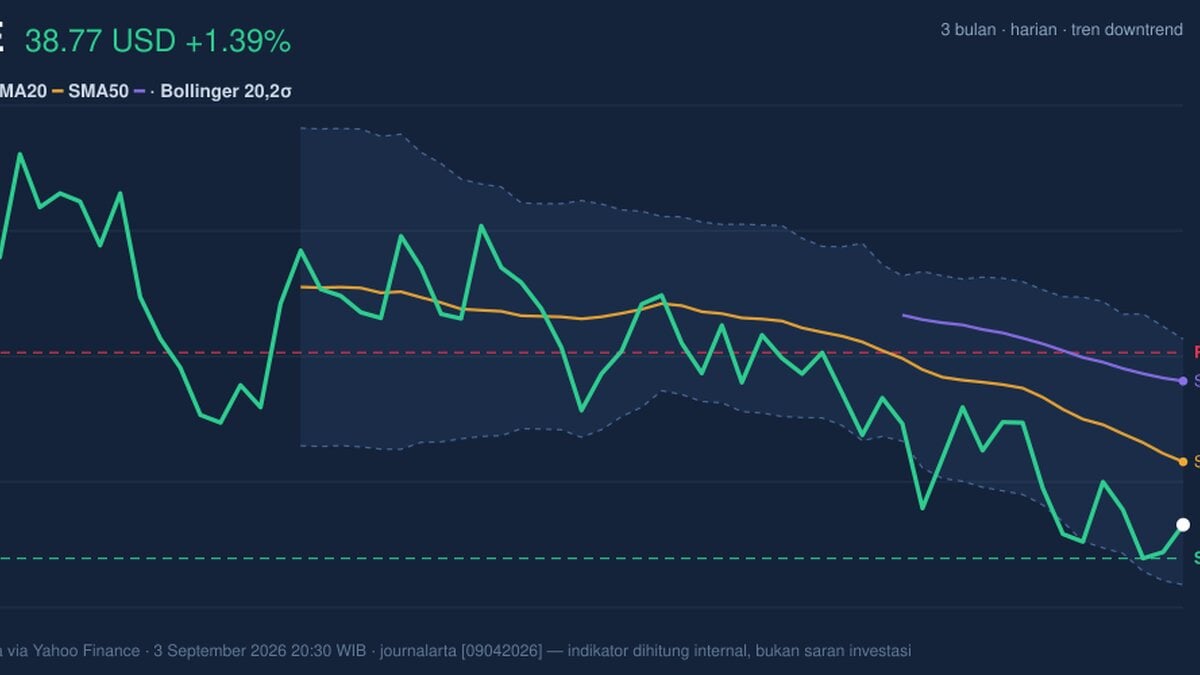
Nike’s shares on the NYSE rose to 38.77 USD, up from 38.24 the previous close, but the move still sits inside a broader slide that has left the stock 7.69% lower over the past month, according to market data compiled from Yahoo Finance. The key signal is not the day’s bounce itself; it is that price remains below both the short- and medium-term trend markers, which means the recovery attempt is happening while the stock is still trading under pressure.
Trend & Price Action
As shown in the chart, Nike is still in a downtrend, with the SMA20 at 39.99 and the SMA50 at 41.56 both above the current price. In plain terms, that tells traders the recent average price over 20 and 50 sessions is higher than where the stock trades now, a classic sign that sellers have controlled the tape more than buyers. The SMA20 slope of -2.03% over five days reinforces that the short-term trend is still leaning lower rather than stabilizing. There is also no fresh MA-cross, so the chart does not yet show the kind of moving-average reversal that would suggest a more durable shift in direction.
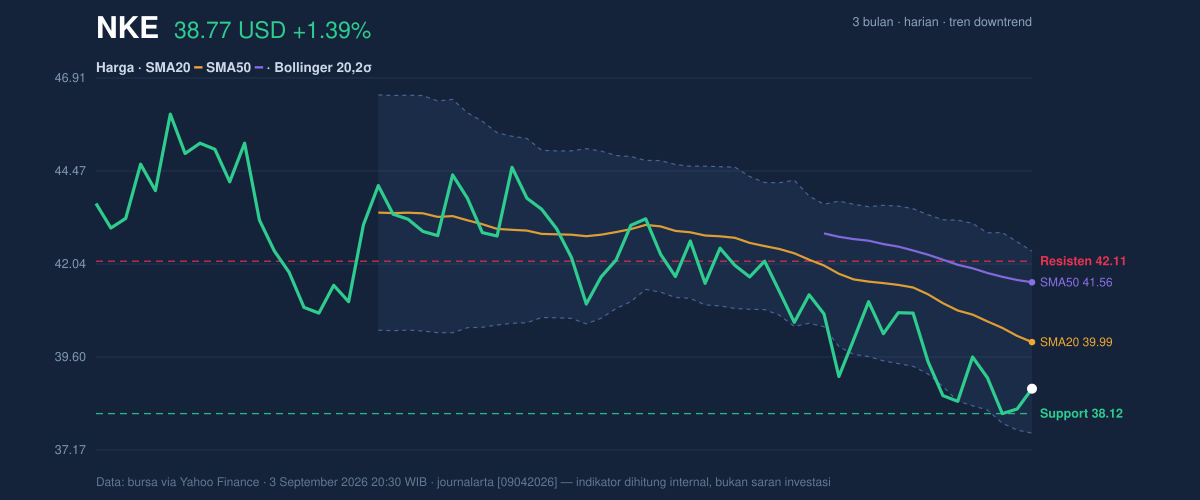
The price is sitting at 16% of the 20-hour range, which is another way of saying it is trading closer to the lower end of the recent band than the upper end. That positioning matters because it suggests the market has not reclaimed the mid-range zone where momentum often starts to improve. The stock is also only slightly above the 3-month low of 37.95, which keeps the recent bounce in context: it is a rebound from near the floor, not a breakout from a base.
A small rise is not the same as a trend change.
Oscillators & Momentum
The momentum picture is mixed, but not in a bullish way. The RSI at 41.8 is best read as neutral-to-weak: it is no longer in oversold territory, yet it is still below the midpoint that would usually suggest stronger buying pressure. The Stochastic %K at 24.2 and %D at 12.2 also point to a market that has been weak enough to cool off, but not strong enough to confirm a real turn. In simple terms, these oscillators say the stock is no longer stretched to the downside, but they do not yet show convincing upward momentum.
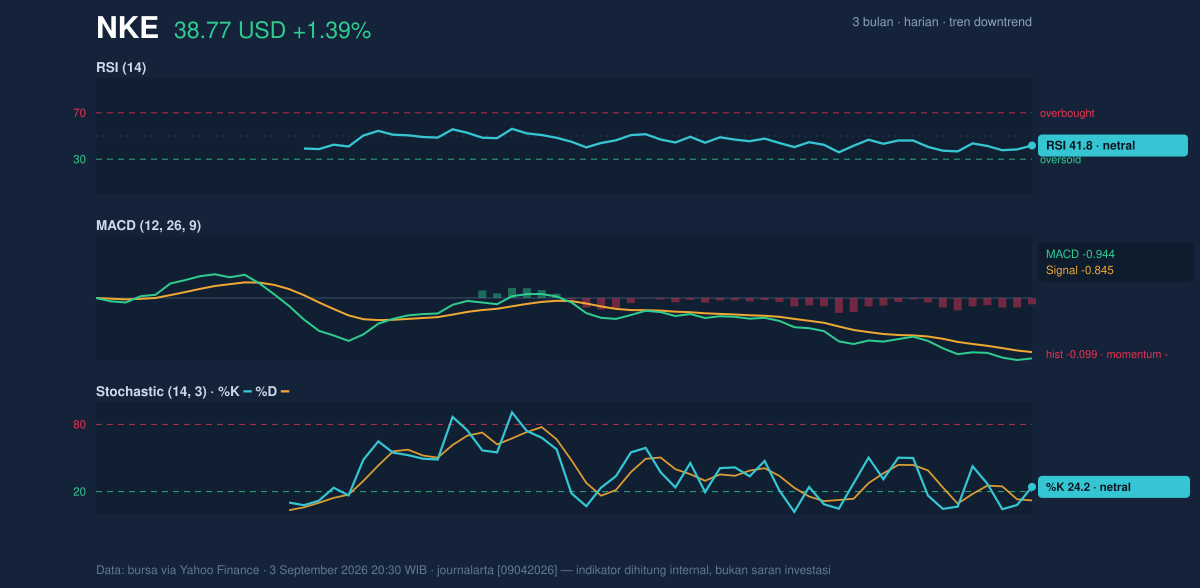
The more important warning comes from the MACD at -0.944, below its signal at -0.845, with a histogram of -0.099. MACD is a trend-following momentum tool, and when it stays below the signal line, it means downside momentum still has the upper hand, even if the pace of decline is not accelerating sharply. That is why the recent gain should be treated as a bounce inside a weak structure rather than evidence of a clean reversal.
Volatility & Volume
Volatility is present, but not extreme. The ATR(14) at 1.13, equal to 2.9% of price, indicates a market that can still move meaningfully from day to day without being in panic mode. The Bollinger Bands show the stock trading near the lower half of its recent volatility envelope, with the lower band at 37.61, the middle band at 39.99, and the upper band at 42.37. The %B at 24% means price is sitting closer to the lower band than the upper band, which often reflects weakness or a market that has yet to regain balance. At the same time, the 11.9% band width is described as normal, so this is not a compression setup that would typically precede an explosive move.
Volume adds an important caveat. Last session volume was 29,534,500, a little above the 20-hour average of 27,846,660, or 1.1× normal. That tells us the move had participation, but not a dramatic surge in conviction. More telling is that OBV is down; on-balance volume tracks whether trading activity is leaning toward accumulation or distribution, and a falling OBV suggests that, despite the day’s uptick, the broader flow of shares has still favored sellers.
The crowd participated. It did not yet commit.
Key Levels & Scenarios
The nearest support is 38.12, while resistance sits at 42.11. Since the stock is trading just above support and well below resistance, the market is boxed into a range where the next move matters more than the current one. A break above 42.11 would put the stock back inside the upper part of the recent band and closer to the upper Bollinger band at 42.37, which would be the first sign that the rebound is gaining traction. If that fails and price slips below 38.12, the chart would be vulnerable to a retest of the 3-month low at 37.95 and possibly the lower Bollinger band at 37.61, where sellers have already shown they can press the stock.
Technical Verdict: HOLD (wait & see)
HOLD (wait & see)
- Price is below SMA20 at 39.99 and SMA50 at 41.56, so the stock remains under its short- and medium-term averages.
- MACD is negative at -0.944 and below its signal at -0.845, which keeps downside momentum in place.
- RSI at 41.8 and Stochastic at 24.2/12.2 show weakness without a clear reversal signal, while volume is only 1.1× normal and OBV is down.
Verdict invalidated if price breaks above 42.11 and then holds above the upper Bollinger band at 42.37, or if it falls below 38.12 and loses the 37.95 low.
- Ideal Entry Range: 38.12 to 39.99
- Exit Target: 42.11 to 42.37
- Stop Loss protection: below 37.95
For non-traders, this means Nike has stopped falling sharply, but it has not yet proved that the decline is over.
“The next move has to earn trust.”
Summary Data NKE
| Last price | 38.77 USD |
| Change 1 day / 5 days / 1 month | 1.39% / 0.86% / -7.69% |
| Trend / MA-cross | downtrend / none |
| SMA20 / SMA50 | 39.99 / 41.56 |
| RSI (14) / Stochastic %K | 41.8 / 24.2 |
| Bollinger %B / ATR | 24% / 1.13 |
| Support / Resistance 20 days | 38.12 / 42.11 |
| Data as of | 3 September 2026 20:30 WIB |
Track NKE stock price daily: live levels, support/resistance and our full NKE analysis history.