ADBE Stock Analysis: Gains 2.13%, Momentum Weakens
On September 4, 2026: price 285.75 USD, trend uptrend, RSI 61.0, support 254.04, resistance 292.79. technical analysis of adbe stock. ADBE Stock Analysis —…
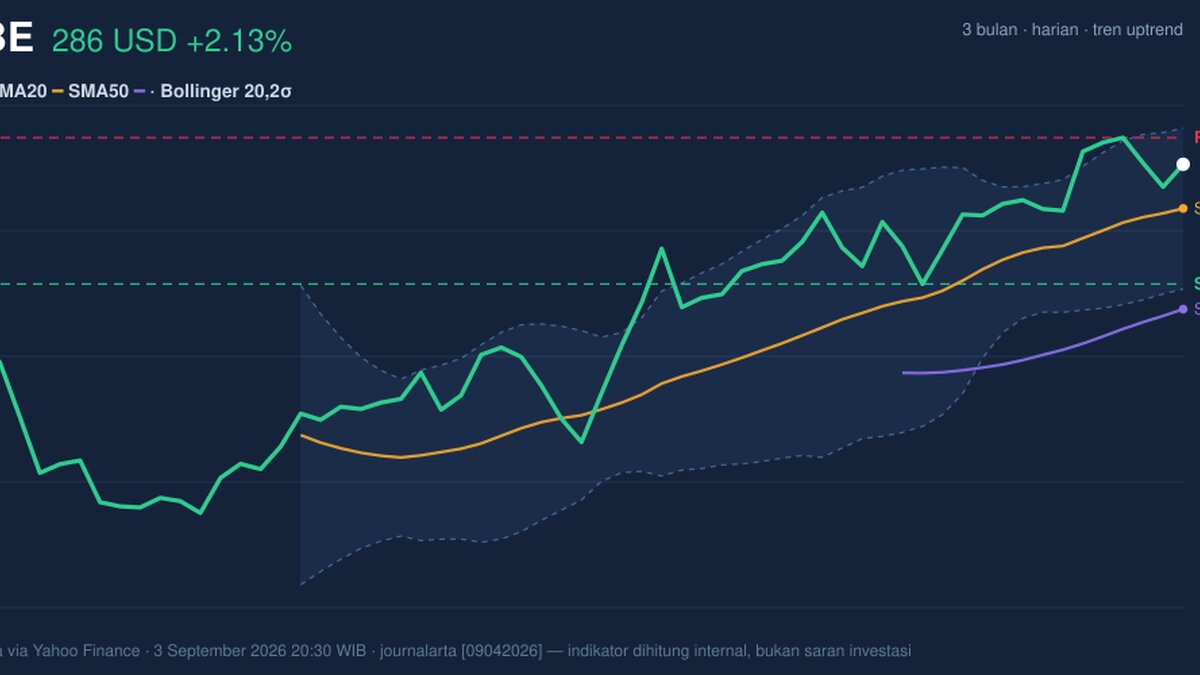
Adobe Inc. (NASDAQ: ADBE) rose to $285.75 on Nasdaq in the latest session, up 2.13% from the previous close of 279.79, with the stock now sitting near the upper end of its 20-day trading band and just below the recent ceiling at $292.79. The move matters because it leaves Adobe in a constructive uptrend, but not a clean breakout: price is above both its SMA20 at $274.05 and SMA50 at $247.39, yet momentum indicators are no longer fully confirming the advance. In plain language, the shares are still being carried by the broader trend, but the latest push is showing some fatigue as the market tests whether buyers can extend the move beyond the recent high.
Trend & Price Action
The price structure remains favorable. Adobe is trading above its SMA20 and well above its SMA50, which tells us the medium-term trend is still pointing higher. The SMA20 is rising, with a 5-day slope of 2.95%, a sign that the short-term trend is not just drifting upward but accelerating. That said, there has been no new MA-cross, so the chart is not flashing a fresh trend-change signal; instead, it is showing an already-established uptrend that is being tested near the top of its range.
As shown in the chart, Adobe is trading at about 82% of its 20-hour range, between support at $254.04 and resistance at $292.79. That placement is important: it means the stock is closer to resistance than support, so the market is pricing in continued strength, but there is less room for easy upside unless buyers can absorb supply near the top. The stock is also only a few dollars below the 3-month high of $294.53, which reinforces the idea that this is a momentum test rather than a bargain entry.
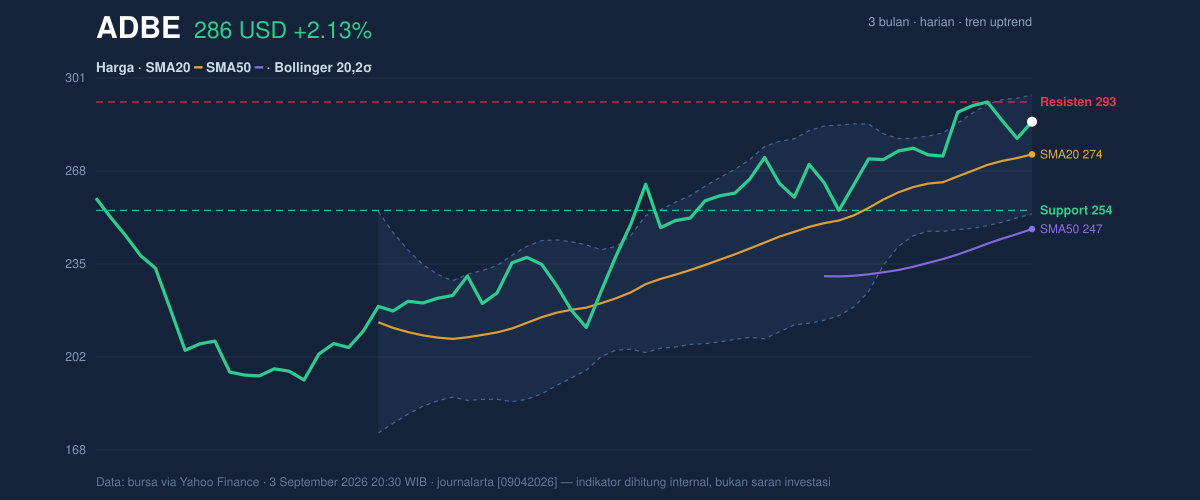
A strong trend, but not a free pass.
Oscillators & Momentum
The momentum picture is more mixed than the price trend. RSI at 61.0 is still in a neutral zone, which means the stock is not overextended enough to suggest an immediate reversal, but it is also no longer in the “freshly bullish” zone that often accompanies stronger upside continuation. The Stochastic %K at 79.7 and %D at 75.4 are also neutral, but they are hovering near the upper end of the scale, which usually means the stock is near a short-term stretch point rather than a deeply discounted one.
The more cautionary signal comes from MACD at 10.669 versus its signal line at 10.759, with a histogram of -0.090. That negative histogram means the shorter-term pace of price gains has slipped just below the longer-term pace that MACD tracks. For readers unfamiliar with the indicator: MACD turning negative does not automatically mean the trend is broken, but it does mean the current rally is losing a bit of force and may need fresh buying to keep advancing. In other words, the trend is still up, but the engine is not running at full throttle.
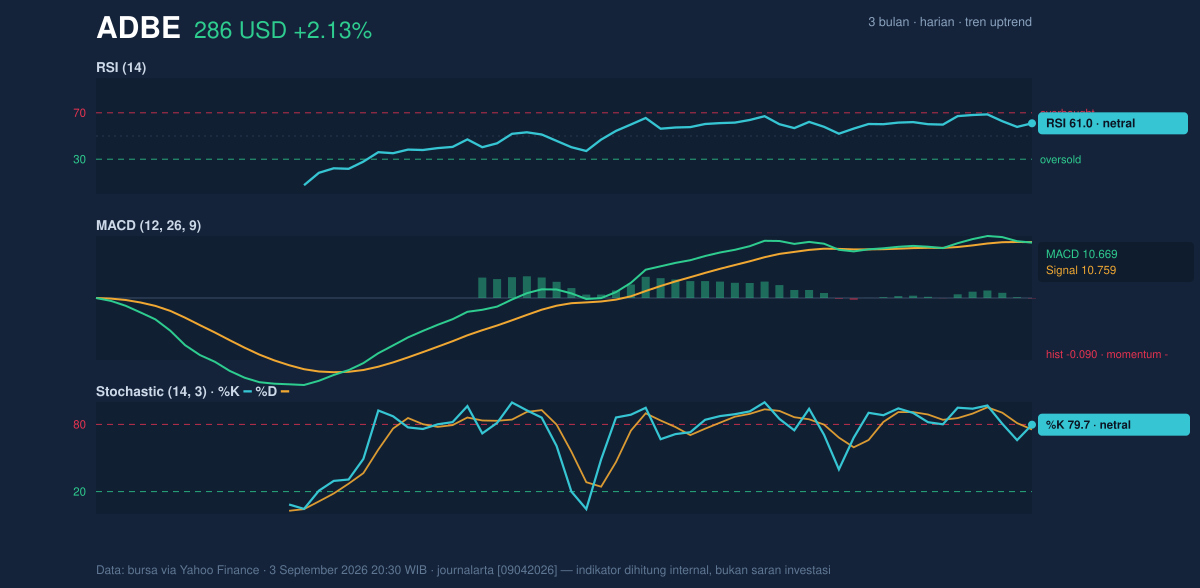
The chart is not bearish — it is just no longer unanimous.
Volatility & Volume
Volatility is moderate. ATR at 9.84, equal to 3.4% of price, suggests Adobe can still move meaningfully in a session, but not in a disorderly way. The Bollinger Bands help frame that better: the upper band sits at $295.33, the middle band at $274.05, and the lower band at $252.77. With %B at 77% and band width at 15.5%, the stock is trading in the upper portion of its volatility envelope, but the bands are not especially tight. That matters because a squeeze is usually what precedes a sharp expansion; here, the band width is normal, which points to a market that is active but not yet primed for an explosive compression breakout.
Volume adds another layer of nuance. Last session’s volume of 3,538,800 was below the 20-hour average of 4,224,710, or about 0.8x normal. That means the latest rise happened without full participation, which slightly weakens the signal of conviction behind the move. However, OBV is rising, and that is useful because on-balance volume tracks whether money is broadly accumulating over time. Rising OBV tells us the broader crowd has been leaning into the stock even if the latest session was not especially heavy.
A quieter rally is still a rally.
Key Levels & Scenarios
The market is now focused on a narrow band between nearby support and resistance. The most immediate line in the sand is $274.05, which is both the SMA20 and the Bollinger middle band. If Adobe stays above that area, the trend remains intact and the stock can keep pressing toward $292.79 and then the 3-month high of $294.53. A move through that zone would signal that buyers have absorbed the recent supply and are willing to pay up for continuation.
If the stock fails to hold the $274.05 area, the next support to watch is $254.04. That would indicate the market is moving from trend extension back toward a deeper consolidation zone. Below that, the lower Bollinger band at $252.77 becomes important as a volatility boundary: a break under it would suggest the recent advance has lost its cushion and the price is rotating into a weaker technical posture.
The strongest signal to watch is whether Adobe can reclaim the upper part of its range with stronger participation, because the current setup is already close to resistance and the MACD is not fully confirming the price.
Technical Verdict: HOLD (wait & see)
HOLD (wait & see)
- Reason 1: The trend remains constructive because price is above the SMA20 at $274.05 and SMA50 at $247.39, and the SMA20 slope is rising.
- Reason 2: Momentum is mixed: RSI 61.0 and Stochastic 79.7/75.4 are not bearish, but MACD is below its signal line with a -0.090 histogram, showing fading short-term force.
- Reason 3: The stock is already near resistance at $292.79 and the upper Bollinger band at $295.33, while volume came in at only 0.8x normal.
- Verdict invalidated if price breaks below $254.04, because that would mean the nearest support has failed and the current uptrend is losing structure.
- Ideal Entry Range: $274.05 to $285.75
- Exit Target: $292.79 to $294.53
- Stop Loss protection: below $254.04
For non-traders: Adobe is still trending higher, but the stock is close to resistance and the latest momentum signals say the move needs confirmation rather than blind confidence.
The next technical checkpoint is whether Adobe can close above $292.79 and challenge the $294.53 3-month high.
Summary Data ADBE
| Last price | 285.75 USD |
| Change 1 day / 5 days / 1 month | 2.13% / -1.18% / 9.80% |
| Trend / MA-cross | uptrend / none |
| SMA20 / SMA50 | 274.05 / 247.39 |
| RSI (14) / Stochastic %K | 61.0 / 79.7 |
| Bollinger %B / ATR | 77% / 9.84 |
| Support / Resistance 20 days | 254.04 / 292.79 |
| Data as of | 3 September 2026 20:30 WIB |
Track ADBE stock price daily: live levels, support/resistance and our full ADBE analysis history.