Testing Key Resistance, T Stock Gains 0.92% Today
On September 4, 2026: price 26.19 USD, trend uptrend, RSI 69.4, support 23.79, resistance 26.19. technical analysis of t stock. Testing Key Resistance — full…
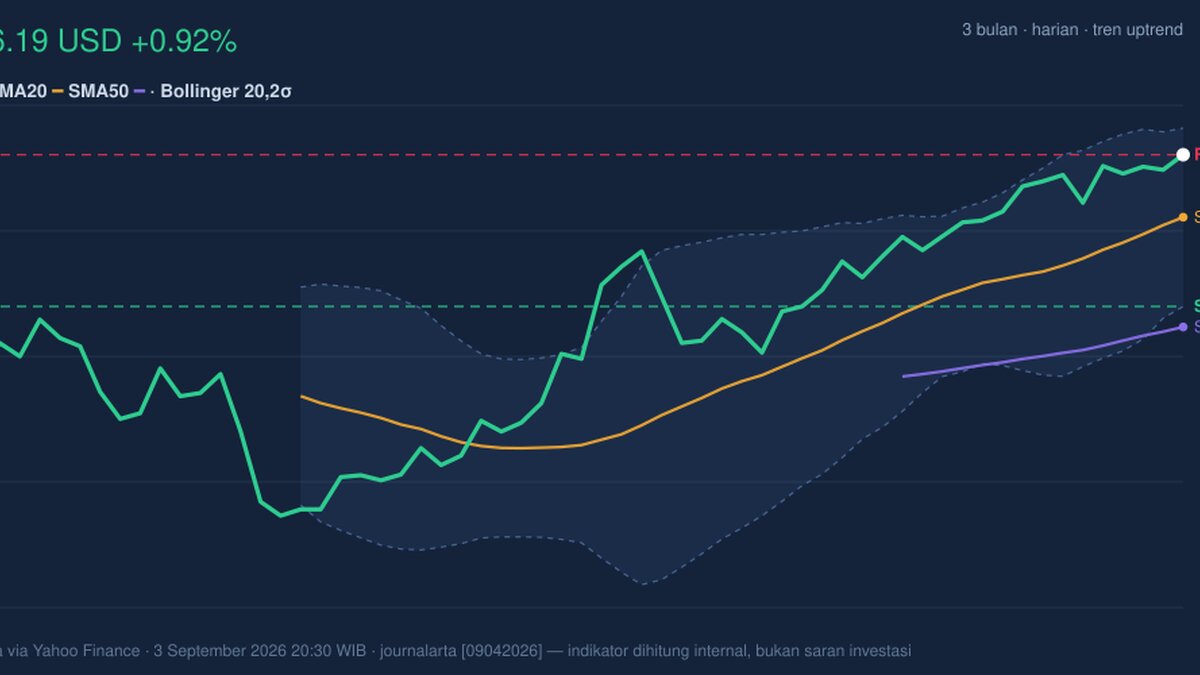
AT&T ended at 26.19 USD, up 0.92% on the day and 10.46% over the past month. That is a clean recovery, but the move now sits right at the edge of the stock’s recent trading range, which makes the next stretch more about whether momentum can keep stretching than whether the trend still exists.
Trend & Price Action
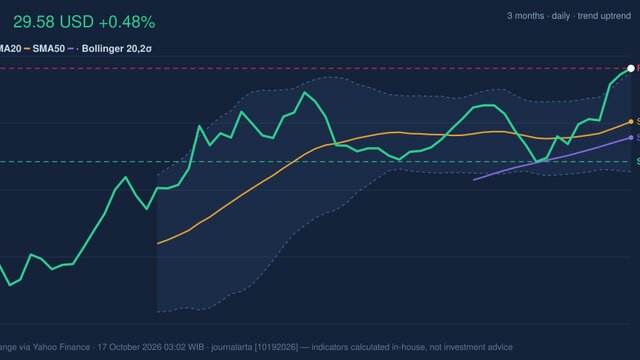
The chart shows a stock that has been climbing above its short- and medium-term trend lines. AT&T is trading above its SMA20 at 25.20 and well above its SMA50 at 23.47, which tells investors the recent advance is not just a one-day bounce but part of a broader upward structure. The uptrend label is reinforced by the 2.66%/5-day slope of the SMA20, a sign the average itself is still rising rather than flattening out.
That matters because a rising moving average usually means buyers have been willing to pay progressively higher prices over several sessions. There is no new MA cross, so the message is less about a dramatic technical turning point and more about trend persistence: the stock has already crossed into stronger territory and is now trying to hold it.
The current price is also sitting at the top of the 20-hour support/resistance range at 23.79 to 26.19, as shown in the chart. In plain terms, AT&T has reached the upper boundary of its recent short-term channel. That can be healthy if it pauses and consolidates; it can also be a warning if the move runs too far ahead of itself.
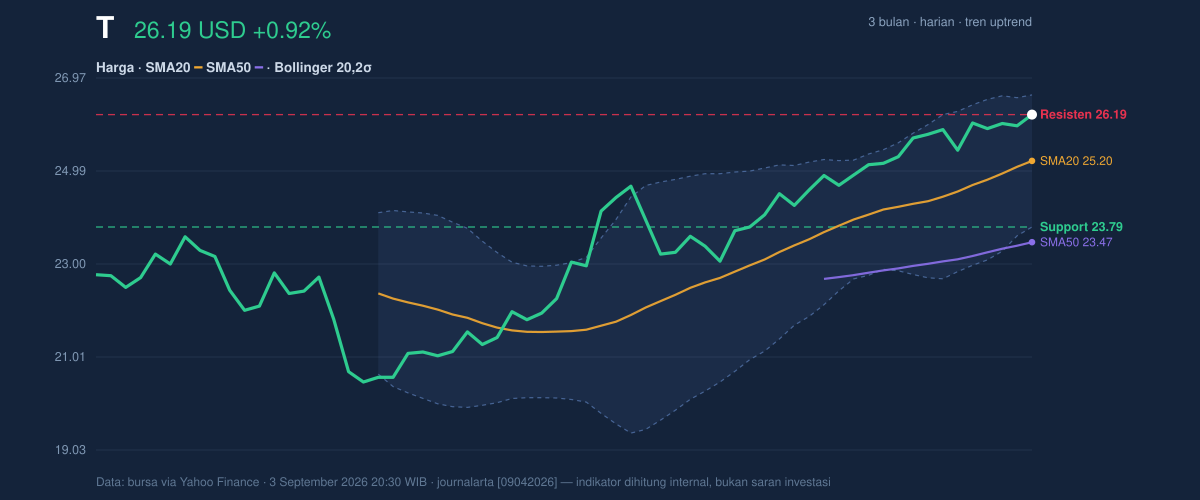
The broader three-month range adds context: 26.44 is the recent high and 19.89 the low. With the latest print at 26.19, the stock is pressing near the upper end of that band, so the market is effectively asking whether this rally has room to extend or whether it is nearing a near-term ceiling.
Oscillators & Momentum
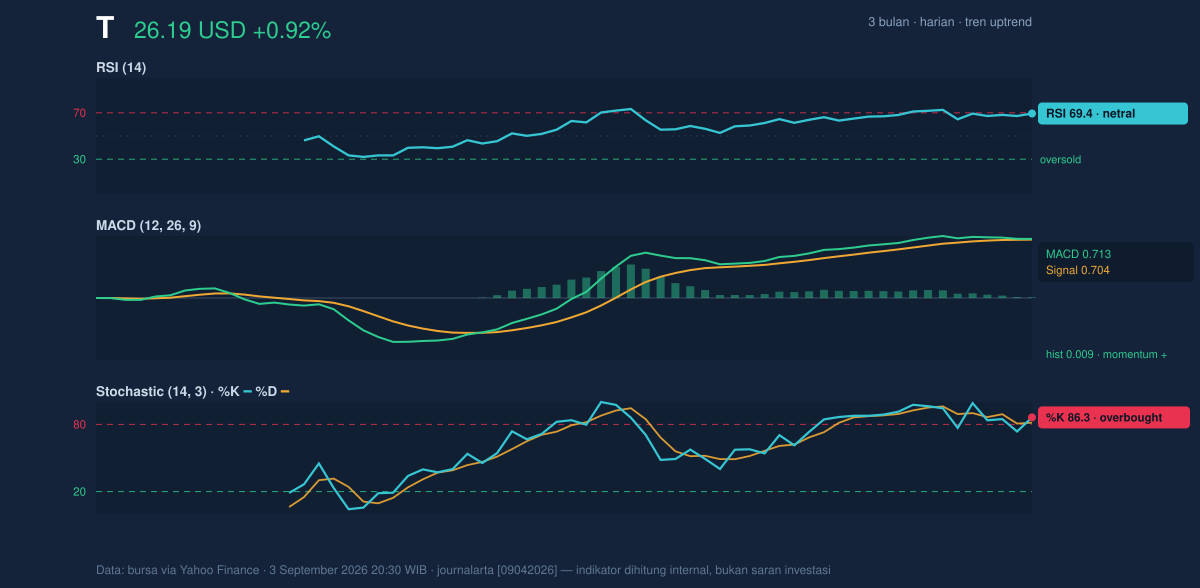
Momentum is still positive, but it is beginning to look stretched. The RSI at 69.4 sits just below the classic overbought threshold, which means the stock is not yet flashing a full exhaustion signal, but it is close enough that traders will be watching for hesitation. In practical terms, RSI near 70 often says enthusiasm is strong, yet the next incremental gains may become harder to achieve without a pause.
The Stochastic %K at 86.3 and %D at 81.6 are already in overbought territory. That does not automatically mean the stock must reverse; it means the latest closes have been occurring near the upper end of the recent range, which is consistent with a market that has been buying strength rather than weakness. When Stochastic is this elevated while price is pressing resistance, the risk of a short consolidation rises.
The MACD at 0.713 remains above the signal line at 0.704, with a positive histogram of 0.009. That is a small but important detail: the trend is still confirmed, but the gap is narrow. A positive histogram means upward momentum still dominates; a thin margin, however, suggests the move is not accelerating strongly. In other words, the trend is intact, but it is not bursting higher with much force.
Volatility & Volume
Bollinger Bands show price trading near the upper band at 26.61, with the middle band at 25.20 and the lower band at 23.79. The %B at 85% means the stock is positioned high within the band structure, a sign of strength but also of proximity to the upper boundary. The 11.2% band width is described as normal, so this is not a volatility squeeze that usually precedes a dramatic breakout. Instead, it suggests the stock is moving in a fairly orderly fashion, with enough room for continuation but not a compressed setup begging for a sharp expansion.
Volume supports the move. The latest 32,839,800 shares traded versus a 20-day average of 31,578,745, or about 1.0× normal. That is not a frenzy, but it is enough to say the advance is being participated in rather than drifting on thin trading. The OBV is rising, which is important because on-balance volume tracks whether buying pressure is accumulating over time. Rising OBV alongside rising price usually means the trend has real sponsorship behind it, not just a short-lived spike.
ATR at 0.46, or 1.8% of price, points to moderate day-to-day movement. That is consistent with a large-cap telecom name: not sleepy, not wild. It also means a move through nearby levels can matter quickly, because the stock does not need a huge absolute swing to signal a change in tone.
Key Levels & Scenarios
The immediate line to watch is 26.19, which is both the latest price and the top of the short-term range. Above that, the next visible reference is the 3-month high at 26.44. If AT&T can push through that zone with continued volume and a still-positive MACD, the chart would be signaling that the recent rally is trying to convert from a short-term advance into a more durable breakout attempt.
If it cannot hold the upper band area, the first meaningful support sits at the Bollinger middle band and SMA20 at 25.20. That level matters because it is where the recent trend would be tested against the stock’s average price over the past 20 sessions. A fall back to that area would not automatically break the uptrend, but it would show the rally is losing altitude and needs to prove itself again.
Below that, the 20-hour support at 23.79 becomes the key structural floor. A break below that level would weaken the current bullish case and suggest the market is no longer respecting the recent range.
Technical Verdict: HOLD (wait & see)
HOLD (wait & see)
- RSI at 69.4 and Stochastic at 86.3/81.6 show the stock is near overbought, so upside is still possible but increasingly extended.
- MACD remains positive and OBV is rising, which confirms the trend is still supported by momentum and participation.
- Price is trading at 26.19, right at the top of the short-term range and just below the 3-month high of 26.44, so the chart is close to a decision point.
Verdict invalidated if price falls below 23.79.
- Ideal Entry Range: 25.20 to 23.79
- Exit Target (Target Price): 26.44
- Stop Loss protection level: 23.79
For non-traders, this means the stock still looks healthy, but it is close enough to resistance that the next move matters more than the last one. “We’re not seeing weakness yet,” one market participant could say, “but we are definitely watching whether AT&T can keep climbing without tiring.”
Summary Data T
| Last price | 26.19 USD |
| Change 1 day / 5 days / 1 month | 0.92% / 2.99% / 10.46% |
| Trend / MA-cross | uptrend / none |
| SMA20 / SMA50 | 25.20 / 23.47 |
| RSI (14) / Stochastic %K | 69.4 / 86.3 |
| Bollinger %B / ATR | 85% / 0.46 |
| Support / Resistance 20 days | 23.79 / 26.19 |
| Data as of | 3 September 2026 20:30 WIB |
Track T stock price daily: live levels, support/resistance and our full T analysis history.