Testing Support Level, PEP Stock Drops 1.66% Today
On Juli 20, 2026: price 137.12 USD, trend downtrend, RSI 43.0, support 135.40, resistance 144.98. technical analysis of pep stock. Testing Support Level — full…

PepsiCo fell 1.66% to $137.12 in the latest session, according to exchange data via Yahoo Finance as of 17 July 2026, extending a one-month slide of 3.16% and leaving the stock pinned near the bottom of its three-month range. The trend is down. But the details matter more than the direction: the beverage and snacks giant is drifting lower on light volume, not being dumped in a panic, and its short-term oscillators are now flashing the kind of oversold readings that typically precede at least a pause — if not a bounce. What follows unpacks whether this is a floor forming or a trapdoor about to open.
Trend & Price Action
The structure is unambiguously bearish. PepsiCo trades below both its 20-day moving average ($139.97) and its 50-day average ($144.13) — the two lines traders use to define short- and medium-term trend — and the 20-day line itself is sloping downward at -1.27% per five days. There is no fresh moving-average crossover, which tells us this is a grinding, established downtrend rather than a sudden breakdown. Within its 20-day range, between support at $135.40 and resistance at $144.98, the price sits at just 18% of the range — effectively hugging the floor. From its three-month high of $160.00, the stock has slid to within touching distance of the $134.65 low.
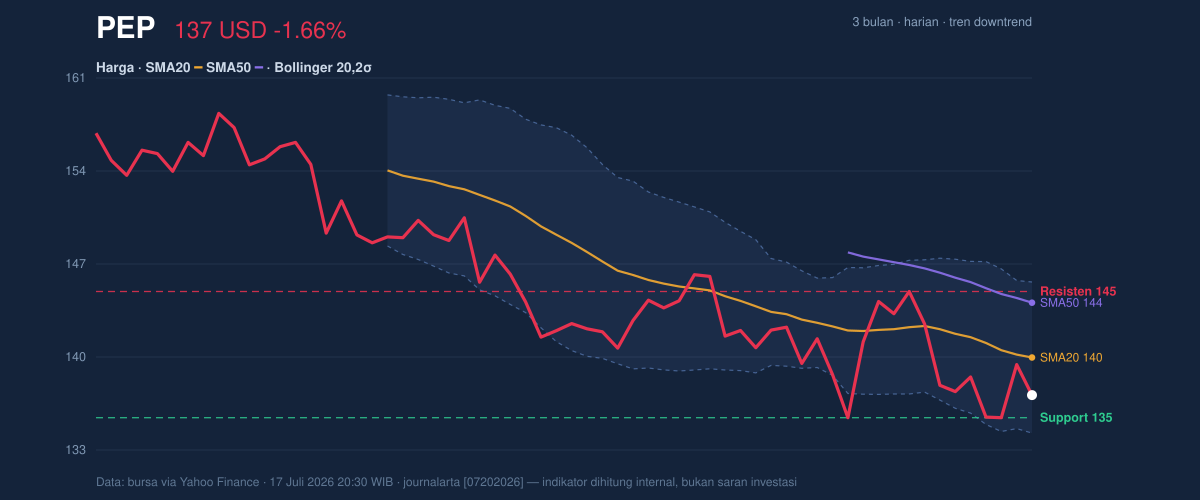
As shown in the chart, the price is riding the lower half of the Bollinger Band envelope, with a %B reading of 25% — meaning it sits a quarter of the way up from the lower band. Weak, but not yet at the sub-zero extremes that mark capitulation.
Oscillators & Momentum
Here the picture splits. The RSI at 43.0 is neutral — the Relative Strength Index, a 0-100 gauge of buying versus selling pressure, shows neither panic (below 30) nor strength (above 70). The Stochastic, however, is oversold at %K 17.2 / %D 18.5, below the 20 threshold that signals short-term selling has run ahead of itself. Meanwhile the MACD remains negative at -1.960 versus its signal line at -1.834, confirming bearish momentum — yet the histogram, at -0.126, is shallow. In plain terms: sellers still control the tape, but their push is losing thrust.
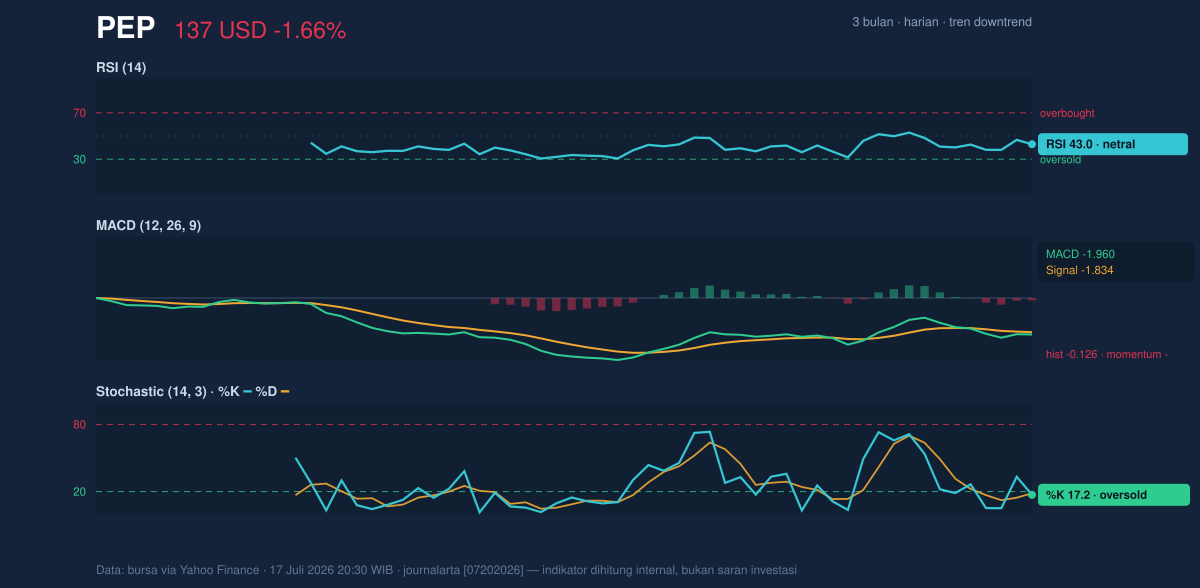
As the momentum chart shows, this combination — neutral RSI, oversold Stochastic, flat MACD histogram — is the classic signature of a late-stage pullback, not a fresh leg down. It is not, however, a reversal signal. That requires the price to reclaim the 20-day average.
Volatility & Volume
Volatility is quiet, which cuts both ways. Band width is a normal 8.2% — no squeeze (which would precede an explosive move) and no expansion (which would confirm an accelerating trend). The ATR of $4.30, or 3.1% of price, means a typical daily swing is moderate; the drift lower is orderly, not chaotic.
Volume tells the more revealing story. The last session printed 8.58 million shares, just 0.8× the 20-day average, and On-Balance Volume is falling. OBV, which accumulates volume on up days and subtracts it on down days, confirms quiet distribution: institutions are trimming, not rushing for exits. The caution for optimists is symmetrical — any bounce on this thin participation would lack conviction until volume expands.
Key Levels & Scenarios
The battleground is tight. Below the market lies a support cluster at $135.40 (20-day support), $134.65 (three-month low) and $134.23 (lower Bollinger Band). If that floor holds and the price reclaims $139.97, the path opens toward $144.13–$144.98, where the 50-day average meets range resistance. If $134.23 gives way on expanding volume, the downtrend re-asserts itself with no nearby historical support in the current data — a re-pricing into unknown territory.
Technical Verdict: HOLD
HOLD (wait & see) — the indicators argue for patience in both directions. First, the trend remains down, with price below both key averages and a negatively sloped SMA20, so chasing strength here means fighting the tape. Second, the negative MACD and falling OBV confirm sellers still hold control. Third — and this is why the verdict is not bearish — the oversold Stochastic and %B of 25% sitting directly atop a triple support cluster mean downside risk-reward at current levels is equally poor. Verdict invalidated if price falls below $134.65, the three-month low, on rising volume.
- Entry Range: $139.97–$140 zone, only on a confirmed close back above the 20-day average; aggressive positioning only after a successful defense of $134.65–$135.40.
- Exit Target: $144.13–$144.98 (50-day average into range resistance), with $145.70, the upper Bollinger Band, as the stretch objective.
- Stop Loss: below $134.23, the lower Bollinger Band — a break there voids the support thesis.
In plain English: the stock is sliding but approaching a floor, and the data says wait for the market to prove which side breaks before committing.
This is technical analysis based on historical price data, not an investment recommendation; the site disclaimer applies.
Summary Data PEP
| Last price | 137.12 USD |
| Change 1 day / 5 days / 1 month | -1.66% / -0.19% / -3.16% |
| Trend / MA-cross | downtrend / none |
| SMA20 / SMA50 | 139.97 / 144.13 |
| RSI (14) / Stochastic %K | 43.0 / 17.2 |
| Bollinger %B / ATR | 25% / 4.30 |
| Support / Resistance 20 days | 135.40 / 144.98 |
| Data as of | 17 Juli 2026 20:30 WIB |


