RSI Overbought, HSBC Stock Gains 0.00% Today
On Juli 20, 2026: price 156.90 HKD, trend uptrend, RSI 70.2, support 147.60, resistance 156.90. technical analysis of hsbc stock. RSI Overbought — full details…

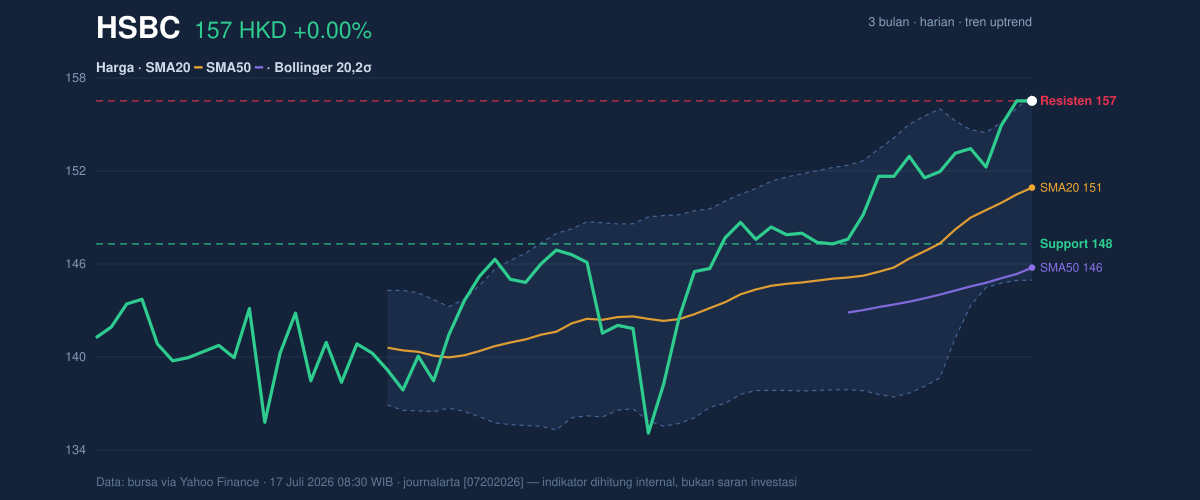
HSBC Holdings spent the latest session sitting precisely on the level that decides its next move. The stock closed flat at 156.90 HKD on 17 July, according to exchange data via Yahoo Finance — unchanged on the day, but that closing print is also the 20-day resistance line, leaving the shares at 100% of their recent range and roughly 1% below the three-month high of 158.40. A 0.00% daily change that says a great deal: buyers have pushed the price to the ceiling, and neither side has yet blinked. The stock is up 2.21% over five days and 6.01% over the past month, so the pressure under that ceiling has been building for weeks.
Trend & Price Action
The underlying structure remains firmly bullish. The price trades above both the SMA20 at 151.26 and the SMA50 at 146.06, and the 20-day average itself is climbing at 1.83% per five days — a steady incline rather than a vertical spike, which typically marks a sustainable advance. There is no new moving-average cross; the uptrend is established, not freshly born. What stands out is how the price is riding the Bollinger structure: with %B at 97%, HSBC is "walking the upper band," a pattern that in strong trends confirms momentum rather than signalling exhaustion. Just as notable, band width has narrowed to 8.0% — a volatility squeeze that historically precedes a sharp expansion in one direction.
Oscillators & Momentum
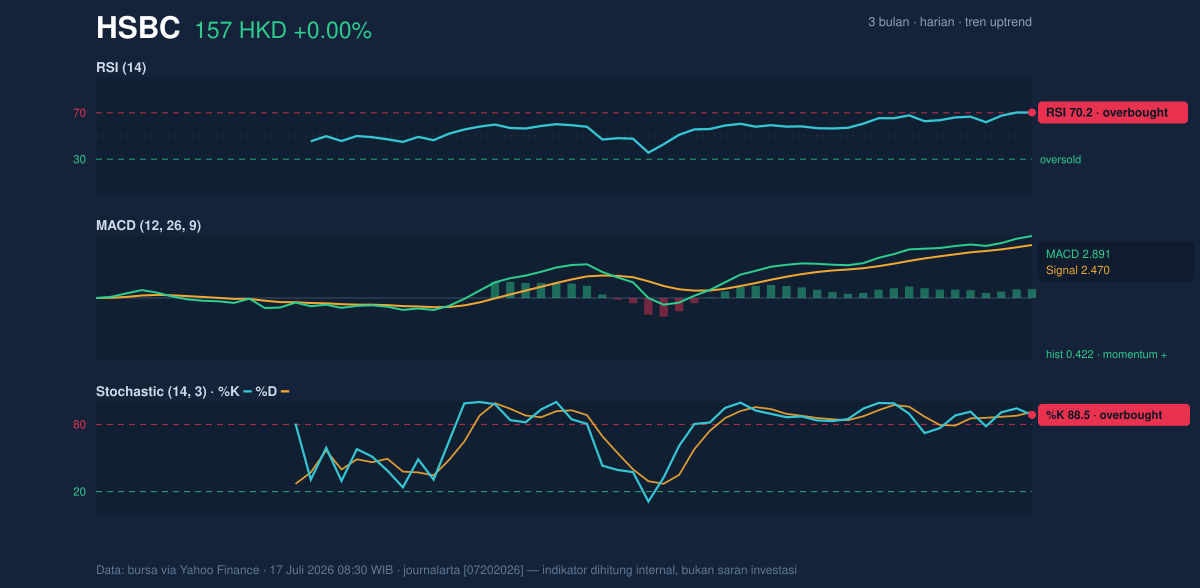
Here the picture turns two-toned. The RSI(14) at 70.2 has just crossed the 70 threshold that technicians label overbought — meaning recent gains have come faster than the average of the past 14 sessions. In strong uptrends RSI can stay elevated for weeks, but it raises the bar for fresh money entering at current levels. The Stochastic adds a quieter warning: %K at 88.5 has slipped below %D at 91.2, a minor bearish cross deep in overbought territory — often the first hairline crack before a pause. Against that, the MACD remains constructive: the line at 2.891 sits above its signal at 2.470, with a positive histogram of +0.422 showing trend momentum is still expanding, not contracting. Translation: the engine is running, but the dashboard is flashing "hot."
Volatility & Volume
The squeeze matters because compression resolves into movement. With the ATR(14) at 2.64 HKD — about 1.7% of the price, a moderate reading — a single average daily swing covers the entire gap between the current close and the three-month high. Participation supports the bulls, but without conviction-grade volume: the last session's 17.65 million shares is 1.2× the 20-day average of 14.42 million, and On-Balance Volume is rising, indicating accumulation is intact. Breakouts, however, usually demand a louder volume signature than 1.2 times normal. The fuel gauge reads "adequate," not "surging."
Key Levels & Scenarios
The map is unusually clean. Overhead sits 156.90 — today's close and the 20-day resistance — then 158.40, the three-month high. A decisive close above 158.40 on expanding volume would resolve the squeeze upward and open uncharted short-term territory. Failure here points the other way: first to the SMA20 at 151.26, then to the 20-day support at 147.60, and finally to the lower Bollinger band at 145.24. A drop through 147.60 would suggest the overbought signals were the early warning they usually are, turning a pause into a deeper mean reversion.
Technical Verdict: HOLD
The indicators argue for HOLD (wait & see) rather than action at the current print:
- Trend and MACD are bullish (price above rising SMA20/50, positive histogram), so there is no technical basis for a SELL stance.
- RSI at 70.2 and Stochastic near 90, with %K crossing below %D, plus the price parked at 100% of its 20-day range, make chasing at resistance a statistically poor entry.
- The Bollinger squeeze with rising OBV says a resolution is close — the edge lies in waiting for it rather than anticipating it.
Verdict invalidated if the price falls below 147.60, which would flip the setup negative.
- Entry Range: 147.60–151.26 (the support-to-SMA20 pullback zone); momentum-style entry only on a confirmed break above 158.40.
- Exit Target: 158.40 (three-month high), with 156.90 as the first checkpoint for pullback entries.
- Stop Loss: below 145.24 (lower Bollinger band), protecting against failure of the 147.60 shelf.
In plain terms: the uptrend is intact, but with the price pressed against the 156.90 ceiling and momentum gauges overheated, the data favours patience — either a dip toward 151.26 or a clean push through 158.40 would offer a clearer signal than today's flat close at exactly 156.90.
Summary Data HSBC
| Last price | 156.90 HKD |
| Change 1 day / 5 days / 1 month | 0.00% / 2.21% / 6.01% |
| Trend / MA-cross | uptrend / none |
| SMA20 / SMA50 | 151.26 / 146.06 |
| RSI (14) / Stochastic %K | 70.2 / 88.5 |
| Bollinger %B / ATR | 97% / 2.64 |
| Support / Resistance 20 days | 147.60 / 156.90 |
| Data as of | 17 Juli 2026 08:30 WIB |



