AIA Stock Drops 0.46% Today, Testing Key Resistance
On Juli 21, 2026: price 75.75 HKD, trend sideways, RSI 52.6, support 70.80, resistance 76.20. technical analysis of aia stock. AIA Stock Drops — full details…

AIA Group shares are pressing against the ceiling of their short-term range. The stock last traded at 75.75 HKD, up 4.27% over five sessions and now sitting at 92% of its 20-day trading band — within a whisker of resistance at 76.20 HKD, according to Hong Kong exchange data as of 17 July. What makes this moment worth watching is not the rally itself, but the compression underneath it: the Bollinger Bands have narrowed to a width of just 7.6%, a "squeeze" that historically precedes a decisive move in one direction or the other.
Trend & Price Action
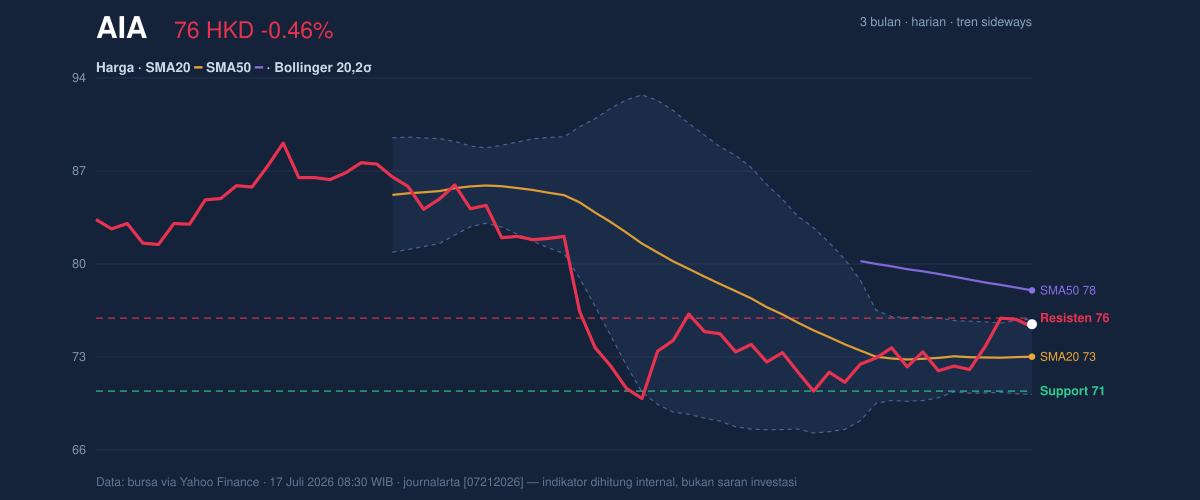
The trend picture is genuinely two-speed. On the short view, AIA has reclaimed its 20-day simple moving average at 73.34 HKD, a line that acts as a rough proxy for the average cost of recent buyers — trading above it means the typical short-term holder is back in profit. On the medium view, the stock remains below its 50-day average at 78.25 HKD, the level institutions tend to watch as the dividing line between recovery and established uptrend. No golden cross — the bullish signal where the short average overtakes the long one — has formed, and the 20-day line itself is still fractionally tilted downward at -0.05% over five days. This is a sideways market repairing itself, not a confirmed uptrend.
As shown in the chart, price is riding the upper Bollinger Band with a %B reading of 93% — meaning it sits near the top of its recent volatility envelope, right where the upper band at 76.13 HKD converges with the 20-day resistance at 76.20 HKD. When two independent barriers stack at the same level, that level matters more.
Oscillators & Momentum
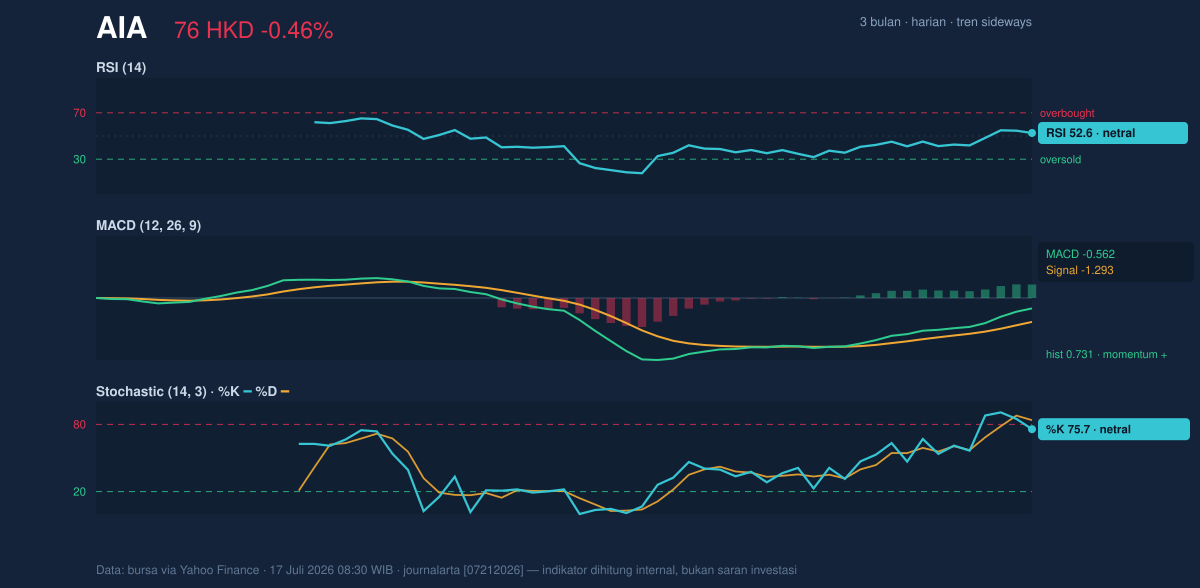
Momentum indicators are improving but stop short of euphoria — which is arguably healthy. The RSI at 52.6 is dead neutral: buyers have regained balance, but neither side dominates. The MACD tells the more interesting story. Its histogram has flipped to +0.731, with the MACD line (-0.562) crossing above its signal line (-1.293). In plain terms, the pace of decline has reversed into acceleration — though with the MACD still below zero, this is a recovery within a correction, not yet a trend reversal.
One caution flag: the Stochastic shows %K at 75.7 slipping below %D at 83.8, a mild short-term cooling signal suggesting the five-day burst is losing some immediate thrust, as visible in the momentum chart.
Volatility & Volume
Daily swings are running at a moderate 2.7% of price (ATR 2.05 HKD) — enough movement for traders, calm enough for long-term holders. The concern is participation. The latest session's volume of 20.3 million shares ran at just 0.7× the 20-day average, meaning the push toward resistance happened on a thin tape. Breakouts that lack volume have a poor track record of holding.
Yet the On-Balance Volume line — a running tally of volume on up-days versus down-days — is still rising. Quiet sessions with steady accumulation often signal that longer-horizon money is building positions without chasing price. The squeeze plus rising OBV is a coiled-spring combination: the breakout, when it comes, could be sharp.
Key Levels & Scenarios
The battleground is narrow. Above, the 76.13–76.20 HKD zone is the immediate gate; a decisive close through it, ideally with volume expanding, would open a run at the 50-day average near 78.25 HKD — roughly one ATR away. Below, the mid-band and 20-day average coincide at 73.34 HKD as first support, followed by the 20-day floor at 70.80 HKD and the lower band at 70.55 HKD. A failure at resistance with the Stochastic already rolling over makes a retest of 73.34 the path of least resistance. The 3-month markers — 89.95 high, 69.05 low — frame just how much ground this recovery has yet to reclaim.
Technical Verdict: HOLD
HOLD (wait & see). The reasoning, strictly from the indicators:
- Breakout unconfirmed: price is pinned at the upper band (%B 93%) and 76.20 resistance while volume runs at only 0.7× average — chasing here means buying into the exact level sellers have defended.
- Momentum is genuinely improving: the MACD histogram at +0.731 and price holding above the 20-day average argue against exiting — the repair job is real.
- The medium trend is not yet bullish: with the stock below its 50-day average at 78.25 HKD and the 20-day line still flat, confirmation requires a breakout, not a hope.
Verdict invalidated if price falls below 70.80 HKD, which would break the recovery structure and expose the 69.05 three-month low.
- Entry range: 76.20–76.50 HKD only on a confirmed close above resistance with rising volume; conservative entries on a pullback that holds 73.34 HKD.
- Exit target: 78.25 HKD (the 50-day average), with the squeeze suggesting potential extension if volume confirms.
- Stop loss: below 73.34 HKD for breakout entries; structural protection below 70.80 HKD.
For non-traders: the stock is knocking on a door it has not yet opened — the sensible stance is to watch whether it walks through or steps back. This is technical analysis, not an investment recommendation.
| Indicator | Value | Signal |
|---|---|---|
| Last price | 75.75 HKD | 92% of 20-day range |
| SMA20 / SMA50 | 73.34 / 78.25 HKD | Above short, below medium |
| Bollinger %B / width | 93% / 7.6% | Squeeze at upper band |
| RSI(14) | 52.6 | Neutral |
| MACD histogram | +0.731 | Momentum positive |
| Volume vs avg | 0.7× | Thin participation; OBV rising |
| Support / Resistance | 70.80 / 76.20 HKD | Breakout gate at resistance |
Summary Data AIA
| Last price | 75.75 HKD |
| Change 1 day / 5 days / 1 month | -0.46% / 4.27% / 0.93% |
| Trend / MA-cross | sideways / none |
| SMA20 / SMA50 | 73.34 / 78.25 |
| RSI (14) / Stochastic %K | 52.6 / 75.7 |
| Bollinger %B / ATR | 93% / 2.05 |
| Support / Resistance 20 days | 70.80 / 76.20 |
| Data as of | 17 Juli 2026 08:30 WIB |


