Alibaba Stock Drops 0.09%, Testing Key Resistance In Focus
On Juli 21, 2026: price 116.80 HKD, trend sideways, RSI 55.8, support 89.50, resistance 116.90. technical analysis of alibaba stock. Alibaba Stock Drops — full…

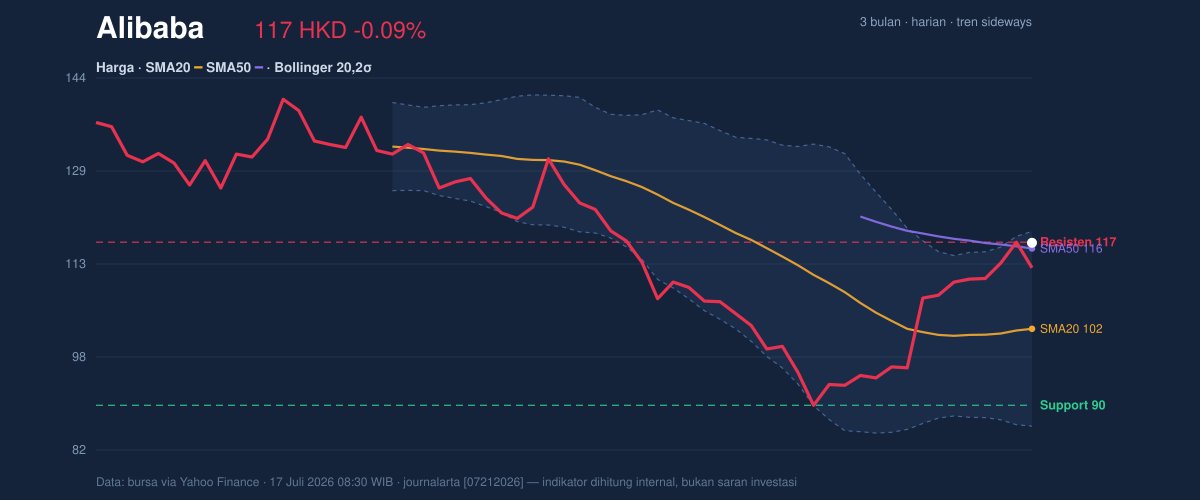
Alibaba Group's Hong Kong-listed shares (9988.HK) closed almost flat at 116.80 HKD on 17 July 2026 — down just 0.09% on the day, according to exchange data via Yahoo Finance — but that calm headline hides a far more interesting story. The stock has climbed 5.99% in five sessions and 9.26% over the past month, and it now sits directly on top of its 20-day resistance at 116.90 HKD. What happens at this exact level will define the next leg.
Trend & Price Action
The official trend reading is "sideways," with the 20-day simple moving average sloping up a modest 1.17% over five days. But the structure beneath that label is improving fast. Price is above both the SMA20 at 102.35 and the SMA50 at 115.84, meaning the recent rally has reclaimed two widely watched trend gauges that institutions use to separate healthy stocks from struggling ones. One caveat: the SMA20 still sits below the SMA50, a leftover of the earlier downtrend, and no fresh bullish crossover has formed yet.
That is a recovery — not yet a confirmed uptrend.
Price is also at 100% of its 20-day range (89.50–116.90), pressing against the ceiling rather than the floor. Bollinger %B reads 94%, meaning the stock is hugging the upper band at 118.70 — a posture technicians call "walking the band," typical of strong but stretched moves.
Momentum: Two Gauges, Two Messages
The momentum picture is split, as shown in the chart. The MACD has crossed into positive territory (0.022 versus a signal line of -2.860, histogram +2.881) — a fresh buy-side signal that typically marks the early stage of a momentum swing, not the end of one. The RSI at 55.8 is neutral, leaving room to run in either direction without being overbought.
The Stochastic oscillator disagrees. With %K at 74.9 now below %D at 86.4, short-term momentum is cooling from elevated levels — a pattern that often precedes a pause or pullback when it occurs at resistance.
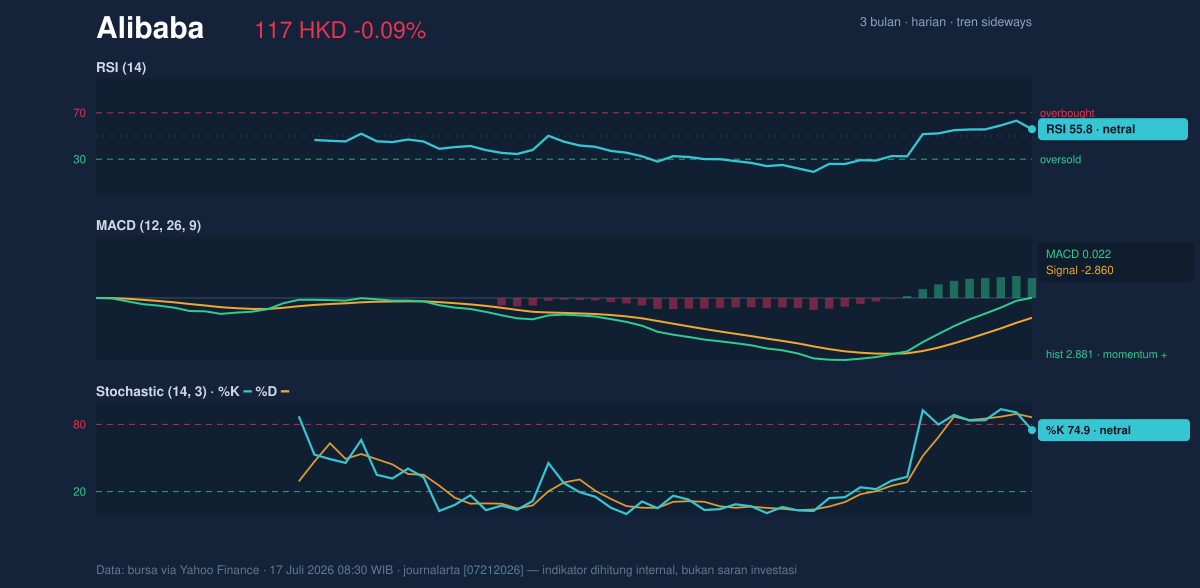
In plain terms: the medium-term engine (MACD) has just switched on, while the short-term throttle (Stochastic) is easing off. That combination argues for digestion, not immediate acceleration.
Volatility & Volume: A Rally Without a Crowd
Volatility is elevated. The Bollinger band width of 32.0% is expanding, and the ATR of 5.66 HKD — 4.8% of the share price — means a normal day now swings the stock by nearly five percent. Expanding bands after a quiet period usually signal that a genuine directional move is underway rather than random noise.
The puzzle is participation. The latest volume of 125.6 million shares is 1.0× the 20-day average — no surge, no stampede. Yet On-Balance Volume, a running tally of buying versus selling pressure, is rising, suggesting quiet accumulation rather than distribution. Either informed money is building positions without fanfare, or the rally simply lacks conviction. A decisive break of resistance on average volume would be less trustworthy than one backed by a volume spike.
Key Levels & Scenarios
- Resistance: 116.90 (being tested now), then the upper Bollinger band at 118.70. A sustained close above 118.70 opens a path toward the three-month high at 144.00.
- Support: SMA50 at 115.84 first, then SMA20 at 102.35, then the 20-day floor at 89.50, with the three-month low at 88.65 and the lower band at 85.99 beneath it.
- Conditional read: if price breaks 118.70 with expanding volume, momentum continuation toward 144.00 becomes the base case; if it fails to hold 115.84, a retest of 102.35 is the higher-probability outcome.
Technical Verdict: HOLD
HOLD (wait & see). Three reasons stand out:
1. Location, location, location. Price is at 100% of its 20-day range with %B at 94% — buying into resistance at the upper band offers poor risk-reward, whatever the long-term story.
2. Mixed momentum. The MACD histogram at +2.881 confirms building upside energy, but the Stochastic %K crossing below %D warns of short-term exhaustion exactly at the 116.90 ceiling.
3. No volume confirmation. A breakout attempt at 1.0× average volume is unproven; rising OBV hints at accumulation but has not yet translated into a decisive thrust.
The constructive case is invalidated if price falls below 102.35 (SMA20) — that would hand control back to sellers and put 89.50 back on the map.
- Entry Range: 115.80–116.90 on a successful hold above the SMA50, or on a confirmed daily close above 118.70
- Exit Target: 118.70 interim; 144.00 (three-month high) as the primary objective
- Stop Loss: below 102.35 (SMA20)
For non-traders: the stock has sprinted into a ceiling after a strong month — the chart says let it either break through or pull back before committing. This is technical analysis, not an investment recommendation.
| Indicator | Reading |
|---|---|
| Last price | 116.80 HKD (-0.09%) |
| 5-day / 1-month | +5.99% / +9.26% |
| SMA20 / SMA50 | 102.35 / 115.84 |
| RSI (14) | 55.8 (neutral) |
| Stochastic %K/%D | 74.9 / 86.4 |
| MACD / histogram | 0.022 / +2.881 |
| Bollinger bands | 85.99 – 118.70, %B 94% |
| ATR (14) | 5.66 (4.8%) |
| Volume vs 20-day avg | 125.6M (1.0×) |
| Support / Resistance | 89.50 / 116.90 |
| 3-month high / low | 144.00 / 88.65 |
Summary Data Alibaba
| Last price | 116.80 HKD |
| Change 1 day / 5 days / 1 month | -0.09% / 5.99% / 9.26% |
| Trend / MA-cross | sideways / none |
| SMA20 / SMA50 | 102.35 / 115.84 |
| RSI (14) / Stochastic %K | 55.8 / 74.9 |
| Bollinger %B / ATR | 94% / 5.66 |
| Support / Resistance 20 days | 89.50 / 116.90 |
| Data as of | 17 Juli 2026 08:30 WIB |


