HSBC Stock Technicals Today: Gains 0.10%, Momentum Weakens
On Agustus 14, 2026: price 1,525.80 GBp, trend sideways, RSI 55.5, support 1,480.80, resistance 1,597.40. technical analysis of hsbc stock.

HSBC Holdings’ shares on the LSE were last quoted at 1,525.80 GBp on 12 August 2026 at 14:00 WIB, just above the previous close of 1,524.20 GBp and still sitting below the 20-day average of 1,536.94. That positioning matters: the stock is not in a breakout, but neither is it under obvious pressure. It is trading in a sideways trend, with the price near the lower half of its recent range and momentum sending a mixed message rather than a clear one.
The market has been digesting a month-long gain of 3.11% and a 5-day rise of 1.01%, which suggests buyers have been willing to step in, but not with enough conviction to push the shares decisively above the short-term trend line. In plain language, HSBC is holding up, yet the chart is not showing the kind of force that usually comes with a fresh leg higher. The stock remains above the 50-day average of 1,467.21 GBp, which is an important sign that the broader structure is still intact.
Trend & Price Action
As shown in the chart, HSBC is trading below the SMA20 but above the SMA50, a configuration that often signals consolidation rather than a strong trend reversal. There is no new MA cross, so the market has not delivered a fresh trend confirmation either way. The slope of the SMA20 is positive at 0.92% over 5 days, which means the short-term average is still rising even though price has slipped under it. That combination usually points to a market that is pausing, not collapsing.
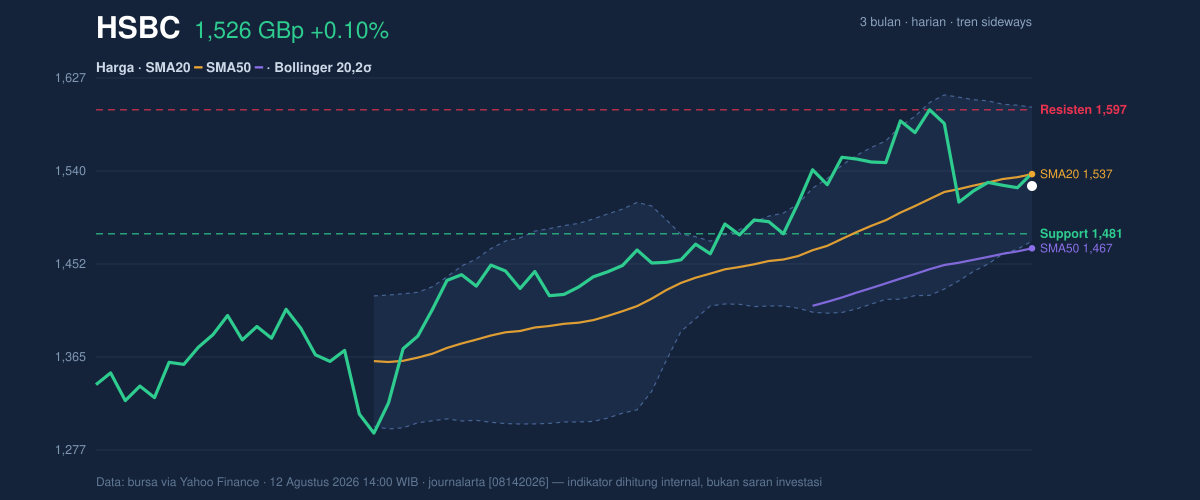
Price is also sitting at about 39% of the 20-hour support-resistance band, between 1,480.80 support and 1,597.40 resistance. That placement is telling: HSBC is closer to support than resistance, but not close enough to suggest a test is imminent. The 3-month high at 1,610.00 GBp and low at 1,267.20 GBp frame the broader trading field, and the current quote remains much nearer the upper end of that range. The signal is one of stability, with the market still respecting the higher part of the multi-month channel.
Oscillators & Momentum
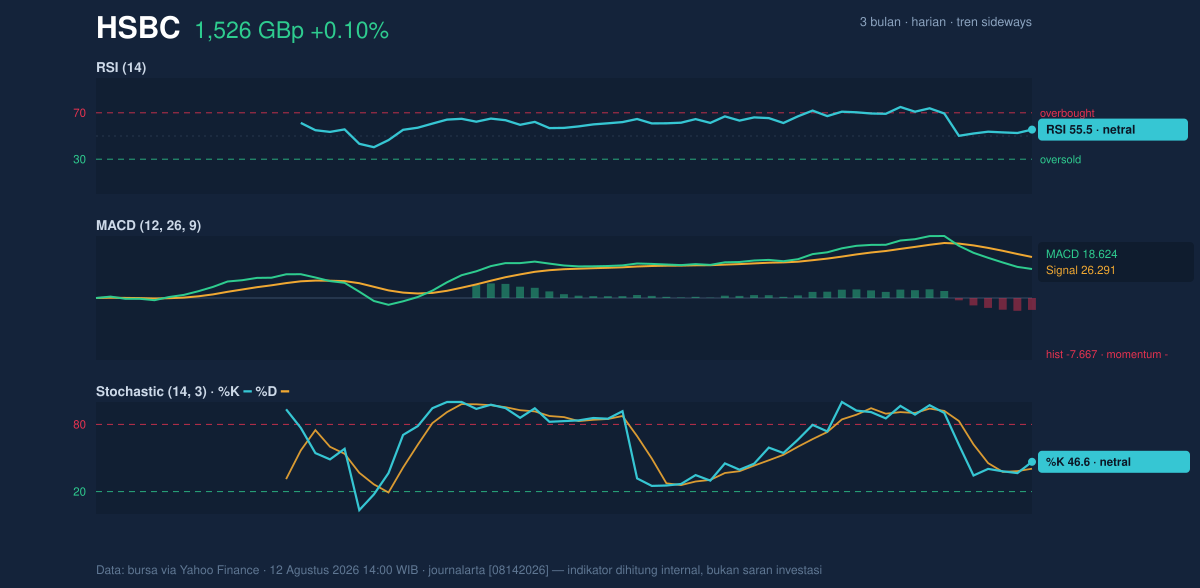
The oscillators are mostly neutral, but not uniformly so. RSI at 55.5 sits in the middle zone, which means the stock is neither overbought nor oversold. Stochastic %K at 46.6 and %D at 40.4 also point to balance rather than urgency. In practical terms, these readings say the shares have room to move either way, but they do not yet show the kind of stretched condition that often precedes a sharp reversal.
The more important message comes from MACD. With MACD at 18.624, the signal line at 26.291 and the histogram at -7.667, short-term momentum is still negative. A negative histogram means the MACD line is below its signal line, which usually indicates that upward momentum has weakened even if price itself has not broken down. So while the broader trend is sideways, the momentum layer is softer than the price action alone might suggest.
Volatility & Volume
Volatility is moderate, not elevated. The ATR(14) of 35.23, equal to 2.3% of price, says the stock can move, but not in a disorderly way. Bollinger Bands reinforce that reading: the band width is 8.2%, described as normal, which means there is no squeeze building for an explosive move and no expansion signaling panic. The price is at %B 41%, meaning it is below the middle band at 1,536.94 and leaning toward the lower half of the envelope. That is consistent with a market drifting rather than accelerating.
Volume adds a useful nuance. Last volume of 31,801,710 was about 1.2x normal versus the 20-day average of 26,755,150, while OBV is rising. Higher-than-average volume with rising on-balance volume suggests participation is still improving under the surface, even if price has not yet confirmed that with a clean move above the short-term average. In other words, there is buying interest, but it has not fully translated into price leadership.
Key Levels & Scenarios
1,536.94 is the first level to watch because it is both the SMA20 and the Bollinger middle band. A sustained move above that area would tell the market that HSBC is reclaiming its short-term trend line. Above that, 1,597.40 is the nearest resistance, and then 1,599.91 at the upper Bollinger band becomes the next technical ceiling. On the downside, 1,480.80 is the key support. If that floor gives way, the chart would shift from sideways consolidation toward a weaker structure, with the lower Bollinger band at 1,473.97 acting as the next reference point.
The current setup is therefore balanced but not fully constructive. Price is still above the 50-day average and supported by rising volume and OBV, yet the negative MACD histogram and the trade below the 20-day average warn that upside momentum is not yet in charge. The chart is waiting for confirmation, not giving it.
Technical Verdict: HOLD (wait & see)
- Reason 1: Price is below the SMA20, which keeps the short-term trend capped despite the positive SMA20 slope.
- Reason 2: MACD histogram is negative, showing momentum is still softer than the price suggests.
- Reason 3: RSI and Stochastic are neutral, so there is no strong oversold or overbought signal to force a directional call.
- Verdict invalidated if price breaks below 1,480.80, the 20-hour support.
- Ideal Entry Range: 1,480.80 to 1,536.94 GBp
- Exit Target (Target Price): 1,597.40 to 1,599.91 GBp
- Stop Loss protection: below 1,473.97 GBp
For non-traders, this means HSBC’s chart is steady but not yet strong enough to call a clear move in either direction.
Last volume: 31,801,710 shares versus a 20-day average of 26,755,150.
Summary Data HSBC
| Last price | 1,525.80 GBp |
| Change 1 day / 5 days / 1 month | 0.10% / 1.01% / 3.11% |
| Trend / MA-cross | sideways / none |
| SMA20 / SMA50 | 1,536.94 / 1,467.21 |
| RSI (14) / Stochastic %K | 55.5 / 46.6 |
| Bollinger %B / ATR | 41% / 35.23 |
| Support / Resistance 20 days | 1,480.80 / 1,597.40 |
| Data as of | 12 Agustus 2026 14:00 WIB |


