INTC Stock Analysis: Gains 3.58%, Testing Key Resistance
On Agustus 14, 2026: price 104.56 USD, trend sideways, RSI 53.2, support 81.88, resistance 105.45. technical analysis of intc stock. INTC Stock Analysis — full…

Intel’s shares are pressing against a short-term ceiling while momentum stays constructive, leaving the stock in a tense spot for international investors watching US semiconductor names.
Intel closed at 104.56 USD, up 3.58% from the previous close of 100.95, according to market data cited from Yahoo Finance. The move matters less as a headline jump than as a test of whether buyers can keep control near the top of the recent trading band. The stock is now sitting close to resistance at 105.45, and that proximity is important: it suggests the market is not simply drifting higher, but is actively probing a level where earlier advances may have stalled.
Trend & Price Action
The broader setup is still best described as sideways, not trending cleanly in either direction. That is reinforced by the SMA20 at 96.45 and the SMA50 at 109.61, with price trading above the SMA20 but still below the SMA50. In plain language, Intel has recovered from near-term weakness, yet it has not fully repaired the longer short-term trend. The absence of a fresh MA-cross means there is no new moving-average signal to confirm a regime change.
The slope of the SMA20 at -0.94% over 5 days also says the recent rebound is happening inside a still-soft trend structure. That is why the chart matters here.
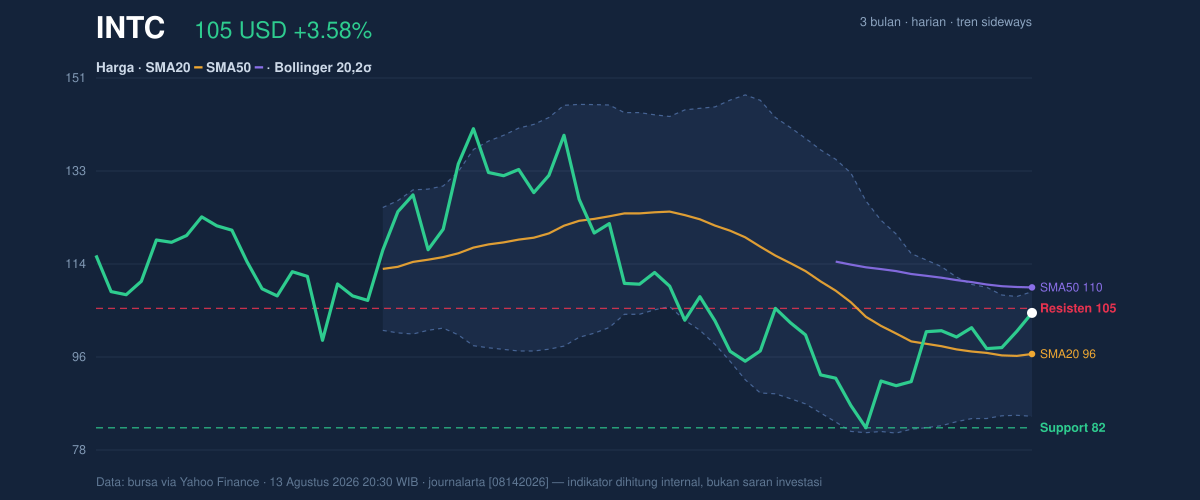
As shown in the chart, the price is trading in the upper part of the Bollinger framework, with %B at 83%. That means Intel is near the upper band rather than the middle of the range, which often signals strength but also a reduced margin for error. The upper Bollinger band at 108.75 is now the next obvious technical reference before the stock can challenge the SMA50 at 109.61. If price cannot clear that zone, the move may remain a range trade rather than the start of a stronger trend.
Oscillators & Momentum
The momentum picture is more supportive than the trend picture. The RSI(14) at 53.2 is neutral, which usually means the stock is neither overextended nor washed out. That is a healthier reading than an overbought or oversold extreme because it leaves room for follow-through without immediately warning of exhaustion.
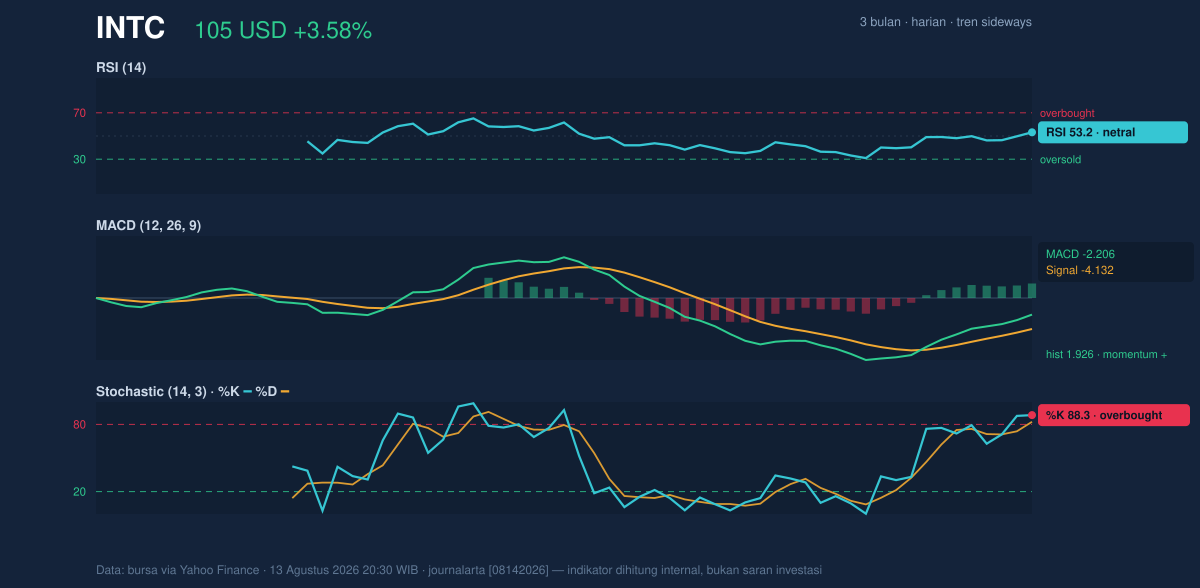
The more interesting signal comes from the stochastic oscillator, where %K at 88.3 and %D at 82.3 both sit in overbought territory. For general readers, that does not automatically mean a reversal is due; it means the stock has been rising fast enough that short-term traders may already be crowded in. When stochastic is overbought while RSI is only neutral, it often points to a market that is strong but stretched at the very near term.
The MACD setup is the most constructive part of the momentum profile. With MACD at -2.206, signal at -4.132, and a histogram of 1.926, the signal line is still below the MACD line and the positive histogram shows upward momentum is improving. In practical terms, that means the stock may be recovering even though the broader trend has not yet fully turned. Momentum is leading price structure, not yet confirmed by it.
Volatility & Volume
Volatility is clearly elevated. The Bollinger band width at 25.5% is described as expanding, and the ATR(14) at 7.08 equals 6.8% of price. ATR, or average true range, is a measure of how much the stock typically moves in a day. A reading this high means Intel can travel quickly in either direction, so breakouts and failures may both be sharper than usual.
That matters because the stock is already trading at 96% of its 20-hour range, with support at 81.88 and resistance at 105.45. In other words, the market is near the upper end of its recent band, where follow-through becomes more important than initial enthusiasm.
Volume does not yet show a dramatic surge. The latest reading of 116,542,400 is roughly 1.0x normal versus the 20-hour average of 120,855,175. That suggests the latest move is not being powered by a clear burst of participation. Still, OBV is rising, and that is a useful confirming sign: on-balance volume tracks whether volume is accumulating on up days or down days. Rising OBV supports the idea that buyers have been willing to absorb supply even without an obvious volume spike.
Key Levels & Scenarios
The market is now focused on a tight cluster of levels. The first checkpoint is 105.45 resistance. Above that sits the upper Bollinger band at 108.75, and then the SMA50 at 109.61. Those are not just numbers; they represent progressively harder tests of whether the rebound is still a short-covering move or something more durable.
On the downside, 96.45 is important because it is both the SMA20 and the Bollinger midline. Losing that area would tell traders that the current bounce has failed to hold the short-term average, which often shifts attention back toward the lower half of the range. Deeper support is anchored by 81.88, close to the 3-month low of 81.79. That proximity matters because it shows the market has already tested the lower end of the broader range this quarter.
The 3-month high at 142.35 frames the larger backdrop, but the stock is still far below that peak, so the present debate is about recovery inside a broad range rather than a full trend reversal.
Technical Verdict: HOLD (wait & see)
HOLD (wait & see)
- MACD is positive and the histogram is expanding, which supports improving momentum.
- RSI is neutral, so the stock is not yet showing a clean overextension signal either way.
- Stochastic is overbought while price is near 105.45 resistance, raising the risk of a pause before any further advance.
Verdict invalidated if price falls below 96.45.
- Ideal Entry Range: 96.45 to 100.95
- Exit Target: 108.75 to 109.61
- Stop Loss protection: below 96.45, with deeper protection below 81.88
For non-traders, this means Intel is improving, but it has not yet proven that the rebound can outrun the nearby ceiling.
Summary Data INTC
| Last price | 104.56 USD |
| Change 1 day / 5 days / 1 month | 3.58% / 4.76% / 7.82% |
| Trend / MA-cross | sideways / none |
| SMA20 / SMA50 | 96.45 / 109.61 |
| RSI (14) / Stochastic %K | 53.2 / 88.3 |
| Bollinger %B / ATR | 83% / 7.08 |
| Support / Resistance 20 days | 81.88 / 105.45 |
| Data as of | 13 Agustus 2026 20:30 WIB |



