INTC Stock Analysis: Gains 3.91%, RSI Overbought
On September 25, 2026: price 127.39 USD, trend uptrend, RSI 72.6, support 88.97, resistance 127.39. technical analysis of intc stock. INTC Stock Analysis —…

Intel is trading at a point where the market is rewarding momentum, but the chart is also flashing the kind of stretched conditions that often come before a pause. On 24 September 2026 at 20:30 WIB, Intel (NASDAQ: INTC) rose to 127.39 USD, up 3.91% on the day, after a 17.09% gain over 5 days and a 44.37% jump over 1 month, according to Yahoo Finance data via the exchange feed.
Trend & Price Action
The main signal is still constructive. Intel is above both its SMA20 at 103.00 and SMA50 at 98.53, and the chart shows a golden cross, where the shorter average moved above the longer one. In plain terms, that usually means recent buying is strong enough to pull the trend upward, not just produce a one-day bounce.
The slope of the SMA20 is 8.37% over 5 days, which matters because it shows the trend is not merely positive, but accelerating. That kind of slope often appears when a stock is being repriced quickly by the market. It can be healthy if earnings or guidance are improving, but it also raises the chance of short-term exhaustion when the move gets too far ahead of itself.
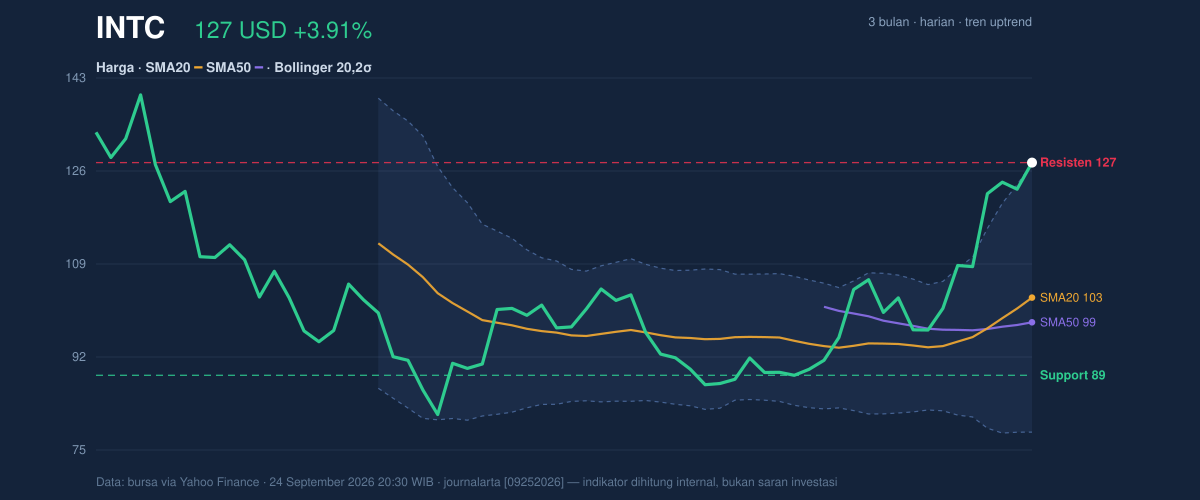
The price is also sitting right at the top of its recent range. The 20-hour support-resistance band runs from 88.97 to 127.39, and Intel is now at the 100% end of that range. That placement is important: it signals strength, but it also means there is little room left before the stock has to prove it can extend further rather than simply hold gains.
The 3-month range adds context. Intel’s 142.35 high is still above current trading, while the 81.79 low shows how much ground has already been recovered. That recovery is one reason the market tone has improved, but it also explains why some traders may treat this area as a test rather than a launch point.
Oscillators & Momentum
The momentum picture is strong, but it is also overheated. The RSI at 72.6 is in overbought territory, which does not automatically mean the stock must fall, but it does mean the recent pace of buying has been unusually fast. The Stochastic %K at 99.9 and %D at 97.3 are even more extreme, showing the stock has closed near the top of its recent trading window for several sessions. That often reflects persistent demand, but it can also signal that momentum is becoming crowded.
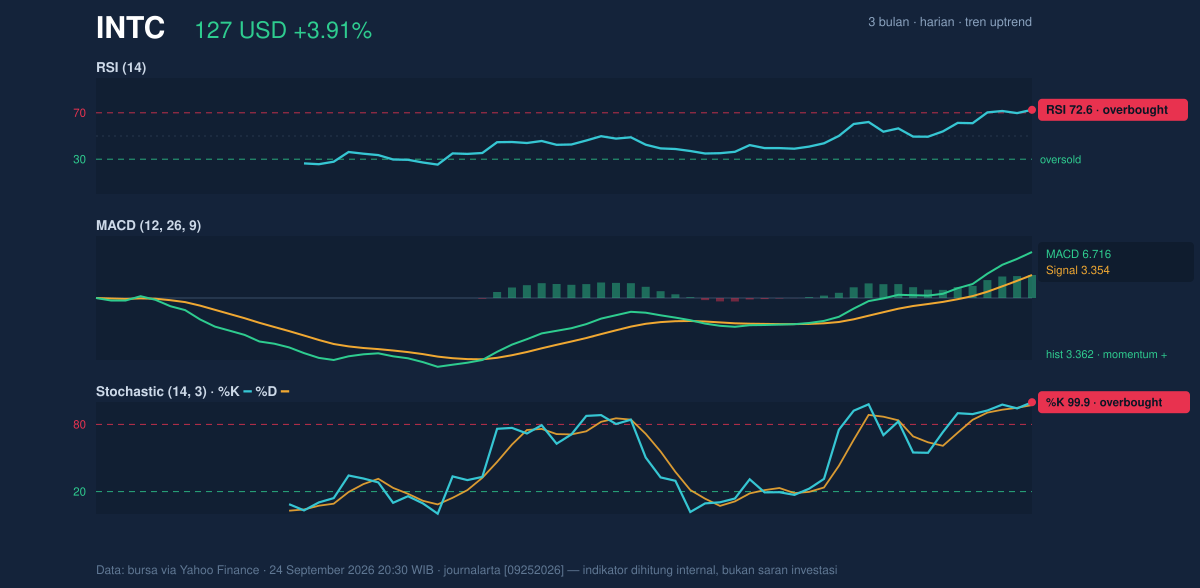
The MACD at 6.716, above its signal line at 3.354 with a 3.362 histogram, still confirms upside momentum. For readers unfamiliar with the term, MACD is a trend-following indicator; when it stays above the signal line, it suggests buyers remain in control. The key point is that Intel’s momentum tools are aligned with the uptrend, not fighting it. The caution is that both RSI and Stochastic are already stretched, so the market is showing strength at the same time it is showing fatigue.
Volatility & Volume
Volatility is elevated, and that changes how the move should be read. Intel’s ATR(14) is 6.92, or 5.4% of price, which means the stock is capable of making large daily swings. The Bollinger Bands reinforce that message: the upper band is 127.30, the middle band is 103.00, and the lower band is 78.70, with a 47.2% wide band structure. A widening band usually means the stock is no longer in a quiet consolidation phase; it is in a directional move with more room for abrupt reversals.
The %B at 100% is especially notable. That means Intel is effectively pressing against the upper Bollinger boundary, a sign of strong demand but also of a market that may be temporarily overextended. In practical terms, when price sits at the upper band while RSI and Stochastic are overbought, the chart is telling you that momentum is strong, but the next session matters a lot.
Volume supports the move. The latest volume was 118,949,000, above the 105,837,385 20-hour average, or about 1.1× normal. That is not a dramatic surge, but it is enough to show participation rather than a thin, isolated spike. Rising OBV also suggests buyers have been accumulating shares as price advances, which strengthens the case that the rally is being confirmed by real trading interest.
Key Levels & Scenarios
The immediate resistance is already being tested at 127.39, which is also the latest high. That makes the current area a decision point. If Intel can hold above this zone, the chart would suggest continuation of the trend. If it slips back under the upper Bollinger band and loses the recent breakout pace, the overbought readings could trigger a cooling phase toward the middle band at 103.00. Below that, the 98.53 SMA50 becomes the next major trend checkpoint, because a fall back under the longer average would weaken the current bullish structure.
Support at 88.97 remains the deeper floor in the 20-hour range, but the more immediate technical message is that Intel is trading near the top of its short-term band. That means the stock is not in a neutral position; it is in a high-stakes zone where continuation and exhaustion are both plausible.
Technical Verdict: HOLD (wait & see)
HOLD (wait & see)
- RSI at 72.6 and Stochastic at 99.9/97.3 show the move is stretched, even though momentum remains positive.
- MACD remains above signal, and the golden cross keeps the broader trend constructive.
- %B at 100% and the price at the 127.30/127.39 upper boundary suggest the stock is pressing resistance rather than building a fresh base.
Verdict invalidated if price breaks below 103.00.
- Ideal Entry Range: 103.00 to 98.53
- Exit Target: 127.39 and, if that level is held, the prior 3-month high at 142.35
- Stop Loss protection: 88.97, with a tighter technical warning if price loses 103.00
For non-traders, this means Intel is strong, but it is already priced near the top of its short-term move.
Summary Data INTC
| Last price | 127.39 USD |
| Change 1 day / 5 days / 1 month | 3.91% / 17.09% / 44.37% |
| Trend / MA-cross | uptrend / golden |
| SMA20 / SMA50 | 103.00 / 98.53 |
| RSI (14) / Stochastic %K | 72.6 / 99.9 |
| Bollinger %B / ATR | 100% / 6.92 |
| Support / Resistance 20 days | 88.97 / 127.39 |
| Data as of | 24 September 2026 20:30 WIB |


