INTC Stock Technicals Today: Gains 12.14%, RSI Overbought
On September 22, 2026: price 121.78 USD, trend uptrend, RSI 70.4, support 87.26, resistance 121.78. technical analysis of intc stock. INTC Stock Technicals —…

Intel’s latest surge puts the stock at the top of its recent range, a sign that momentum is strong but also that the market is paying up for the move.
Intel Corp. (NASDAQ: INTC) was last quoted at 121.78 USD, up 12.14% on the day and extending gains to 25.30% over 5 days and 35.21% over 1 month, according to Yahoo Finance data cited by the exchange feed. That jump matters because it is not just a one-session pop: it has pushed the shares to the upper edge of the recent trading band, where enthusiasm can keep feeding itself until it runs into profit-taking. The stock is now trading well above both short- and medium-term trend markers, and the chart shows a market that has stopped looking for a base and started testing how far buyers can carry it.
Trend & Price Action
The broader message from the moving averages is straightforward. Intel is in an uptrend, with the SMA20 at 97.45 above the SMA50 at 97.33, forming a golden cross. In plain English, that means the shorter trend has moved above the longer one, a pattern often read as a shift from recovery to sustained buying pressure. The fact that price is also above the SMA20 tells us the rally is not merely a bounce off a low; it is being held above the first layer of trend support.
What makes this more striking is where the stock sits inside its range. The 20-hour support is 87.26, while the 20-hour resistance is 121.78, and price is sitting at 100% of the range. That is the kind of positioning that usually reflects strong demand, but it also leaves little room for error. As shown in the chart below, Intel has run beyond the upper Bollinger band area and is now trading in a zone where the market often pauses to decide whether the move is a breakout or an overextension.
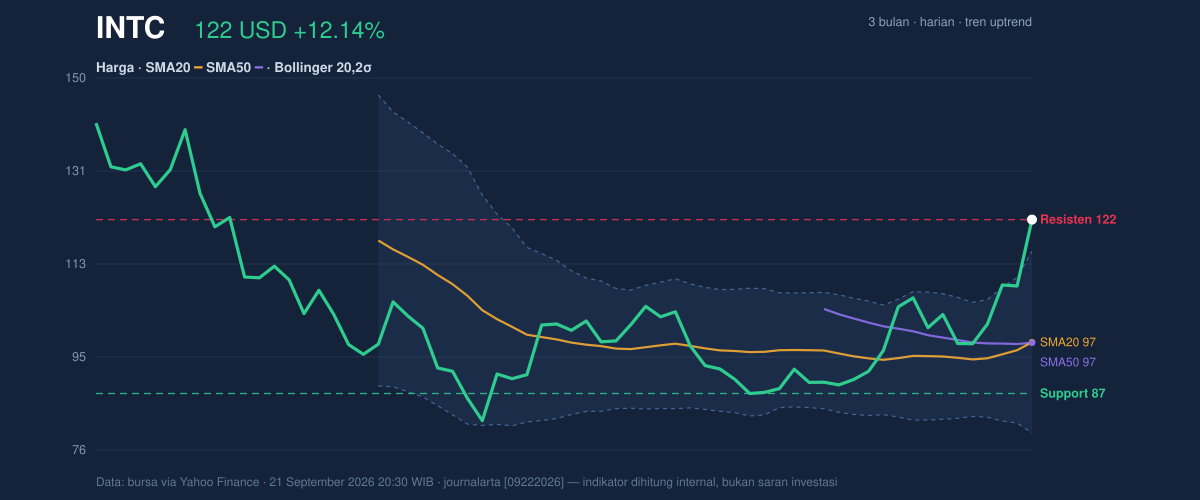
The 3-month context adds another layer. The shares are above the 3-month low of 81.79 and still below the 3-month high of 142.35, so the stock has room to stretch before it revisits the prior peak. But the path from here is not linear. After a move this fast, traders usually watch whether the stock can hold above prior breakout areas; if it cannot, the same speed that lifted it can also amplify a pullback.
Oscillators & Momentum
The momentum gauges are supportive, but they are also flashing caution. The RSI is 70.4, which is in overbought territory. That does not mean the stock must fall immediately; it means the latest advance has been strong enough that short-term buyers may already be crowded in. The Stochastic %K at 92.4 and %D at 90.5 are also overbought, reinforcing the same signal: upside momentum is powerful, but it is stretched.
The MACD at 3.486, above the signal line at 0.836, with a histogram of 2.650, shows that trend momentum is still positive and expanding. In practical terms, MACD is the indicator most likely to keep supporting the move if buyers remain active, because it measures whether recent price gains are still accelerating relative to the longer trend. As shown in the momentum chart, the key tension is that the momentum tools are aligned bullishly, yet they are doing so from an elevated starting point.
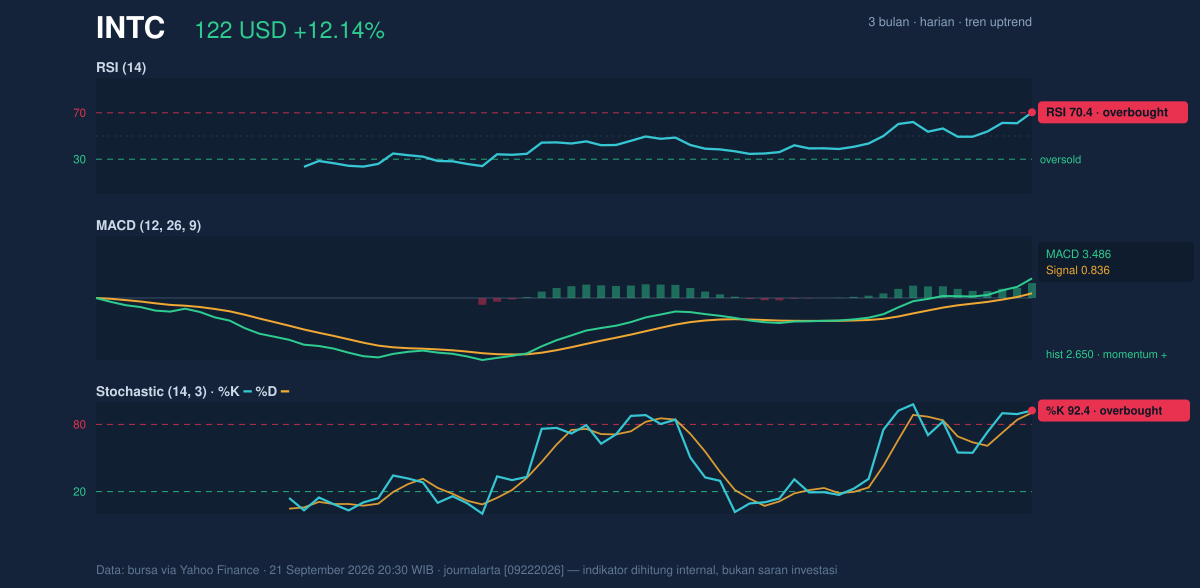
That combination often produces one of two outcomes: either price consolidates while momentum cools, or it keeps climbing while overbought readings stay elevated for longer than expected. The second is possible in strong trends, but the first is usually more common once a stock has already advanced this far in a short window.
Volatility & Volume
Volatility is clearly elevated. The ATR(14) is 6.54, equal to 5.4% of price, which means daily swings can be wide enough to erase a large chunk of gains quickly. The Bollinger Band structure confirms that. With the upper band at 115.51, the middle band at 97.45, and the lower band at 79.40, Intel is now trading above the upper band, and the %B at 117% shows price is extending beyond the normal statistical envelope. The 37.0% band width indicates the bands are expanding, not squeezing, so the market is not calm; it is actively repricing the stock.
Volume supports the move. The latest volume was 190,310,700, nearly 1.9× the 20-hour average of 102,849,025, and OBV is rising. That is important because a rally on thin volume can be fragile, while a rally on heavy participation suggests real demand is behind it. Rising OBV means the cumulative volume trend is confirming price strength rather than diverging from it.
Key Levels & Scenarios
The nearest technical reference points are now less about where Intel has been and more about whether it can keep holding the breakout. The first line to watch is the 20-hour support at 87.26, which marks the lower edge of the recent range. Below that, the SMA20 at 97.45 and the Bollinger middle band at 97.45 become the next important test, because that level represents the short-term trend anchor. On the upside, the immediate reference is the 20-hour resistance at 121.78, which is also the latest price, so any further advance would require a fresh breakout above the current high. Beyond that, the 3-month high at 142.35 is the next major historical marker.
If Intel fails to hold above the short-term trend zone, the message would be that the rally has moved ahead of itself. If it extends above the current high with volume still running above average, that would suggest the market is willing to keep paying for momentum despite overbought readings.
Technical Verdict: HOLD (wait & see)
HOLD (wait & see) fits best because the trend is bullish, but momentum is stretched and price is already at the top of the recent range.
- Golden cross and price above the SMA20 support the trend.
- RSI 70.4 and Stochastic 92.4/90.5 are overbought, warning that the move may need to cool.
- MACD remains positive and volume is 1.9× average, so the breakout still has participation behind it.
Verdict invalidated if price breaks below 97.45.
- Ideal Entry Range: 97.45 to 115.51
- Exit Target (Target Price): 121.78 to 142.35
- Stop Loss protection: 87.26
In plain English: Intel is strong, but after a sharp run, the chart is asking for proof that buyers can keep control.
Summary Data INTC
| Last price | 121.78 USD |
| Change 1 day / 5 days / 1 month | 12.14% / 25.30% / 35.21% |
| Trend / MA-cross | uptrend / golden |
| SMA20 / SMA50 | 97.45 / 97.33 |
| RSI (14) / Stochastic %K | 70.4 / 92.4 |
| Bollinger %B / ATR | 117% / 6.54 |
| Support / Resistance 20 days | 87.26 / 121.78 |
| Data as of | 21 September 2026 20:30 WIB |



