Visa Stock Analysis: Gains 0.45%, Testing Support Level
On September 22, 2026: price 369.95 USD, trend sideways, RSI 49.7, support 367.21, resistance 384.14. technical analysis of visa stock.

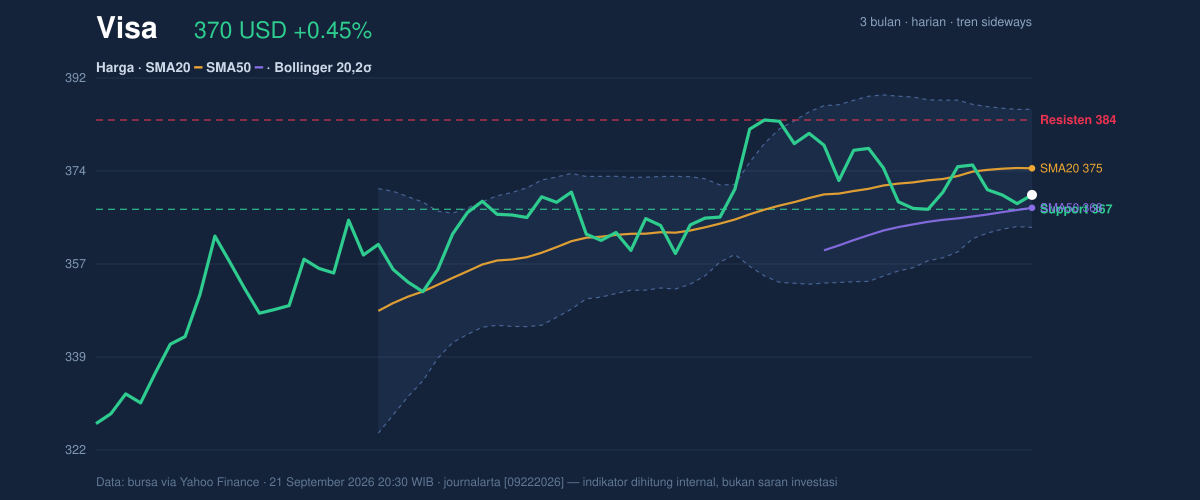
Visa traded at 369.95 USD on the NYSE, edging up 0.45% from the previous close of 368.29, but the bigger message in the tape is that the shares are still sitting below the short-term trend line while the longer line of support is holding. As shown in the chart, that leaves the stock in a narrow technical corridor: not weak enough to break decisively lower, but not strong enough yet to reclaim momentum above the 20-day average.
Trend & Price Action
The price is trading below the SMA20 at 374.98 and above the SMA50 at 367.50, which is a classic sign of a market caught between short-term pressure and medium-term stability. In plain terms, the 20-day average represents the recent direction of travel, while the 50-day average reflects the broader baseline. When price sits between them, as Visa does now, the chart is usually telling investors that conviction is limited and the market is waiting for a catalyst.
There is no new MA-cross, so there is no fresh signal that the trend has flipped in either direction. The sideways trend is reinforced by the SMA20 slope of 0.39% over 5 days, which points to only a mild upward tilt rather than a strong breakout setup. The stock is also near the lower half of its recent range: the 20-hour support sits at 367.21 and resistance at 384.14, while the price is positioned at about 16% of that range. That placement matters because it shows the market is closer to support than resistance, but not yet in a panic zone.
The three-month high and low, 385.57 and 325.86, frame the larger battleground. Visa is well above the lower end of that range, which suggests the medium-term structure has not broken down. At the same time, it remains below the upper boundary, so the stock has not re-established a strong upside trend either.
Oscillators & Momentum
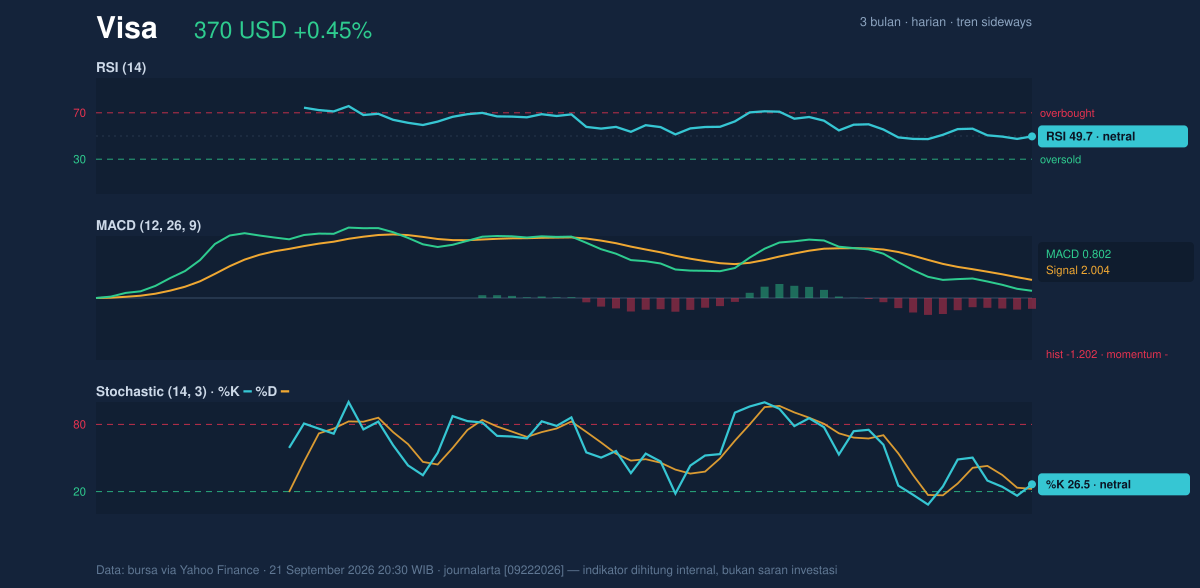
Momentum indicators are sending a mixed but slightly cautious message. The RSI at 49.7 is effectively neutral, which means the stock is neither stretched on the upside nor washed out on the downside. That matters because a neutral RSI usually signals balance rather than urgency: buyers and sellers are still in the game, but neither side has seized control.
The Stochastic %K at 26.5 and %D at 22.4 sits in a low zone, but not at an extreme that would normally scream oversold. In simple terms, the oscillator says the stock has been soft enough to cool off, yet not so weak that it has clearly exhausted selling pressure. As shown in the momentum chart, that leaves room for a rebound, but not enough evidence to call one confirmed.
The more important signal is the MACD histogram at -1.202, with MACD at 0.802 below the signal line at 2.004. MACD is a trend-following tool, and when the histogram is negative it means the shorter-term trend is underperforming the longer-term trend. That is the clearest sign in the data that upside follow-through is still lacking.
Volatility & Volume
Visa’s Bollinger Bands are narrowing, with the band width at 6.0%, and that squeeze often precedes a sharper move. A squeeze does not predict direction; it simply says the market has become compressed and is storing energy. The price is also at %B 28%, which places it in the lower part of the band structure and helps explain why the stock has struggled to push back toward the middle band at 374.98.
The ATR(14) at 5.44, equal to 1.5% of price, indicates low day-to-day volatility. That usually means smaller candles, less dramatic intraday swings, and a market that may need a fresh catalyst to escape the current range. Volume is modestly supportive: 7,085,300 shares traded versus a 20-day average of 6,291,295, or about 1.1× normal. That is enough to show participation, but not enough to prove aggressive accumulation.
The one cautionary detail is that OBV is falling. On-Balance Volume tracks whether trading volume is flowing into rising or falling prices, so a downtrend in OBV suggests that recent volume has not been consistently backing the stock’s attempts to stabilize. In practical terms, the market is trading, but the volume pattern is not yet confirming a durable recovery.
Key Levels & Scenarios
The nearest technical floor is 367.21, closely aligned with the SMA50 at 367.50. That cluster matters because it is where buyers have recently found enough support to prevent a deeper slide. If that area gives way, the chart would likely shift from range-bound to more defensive, with the lower Bollinger band at 363.79 becoming the next visible reference point.
On the upside, the first meaningful barrier is 374.98, the SMA20 and middle Bollinger band. Reclaiming that level would be a sign that short-term pressure is easing. Above that, 384.14 stands as the key resistance from the 20-hour range, and then the upper Bollinger band at 386.17 marks the ceiling of the current compression zone. A move through that area would matter not because it guarantees a trend, but because it would show the squeeze is resolving with strength.
Technical Verdict: HOLD (wait & see)
HOLD (wait & see)
- Price is below the SMA20 at 374.98, which keeps short-term momentum capped.
- MACD histogram is negative at -1.202, showing the trend is still losing internal strength.
- Bollinger Bands are tight at 6.0%, suggesting a breakout may come, but direction is not confirmed.
Verdict invalidated if price falls below 367.21, because that would break the nearest support and the SMA50 cluster.
- Ideal Entry Range: 367.21 to 374.98
- Exit Target: 384.14 to 386.17
- Stop Loss protection: below 363.79
In plain English, the chart says Visa is coiled but undecided, with support still intact and momentum not yet strong enough to declare a clear turn. “We need the market to prove it can hold the floor.”
Summary Data Visa
| Last price | 369.95 USD |
| Change 1 day / 5 days / 1 month | 0.45% / -1.42% / -0.29% |
| Trend / MA-cross | sideways / none |
| SMA20 / SMA50 | 374.98 / 367.50 |
| RSI (14) / Stochastic %K | 49.7 / 26.5 |
| Bollinger %B / ATR | 28% / 5.44 |
| Support / Resistance 20 days | 367.21 / 384.14 |
| Data as of | 21 September 2026 20:30 WIB |



