TSLA Stock Gains 3.03%, Testing Key Resistance In Focus
On September 22, 2026: price 375.30 USD, trend uptrend, RSI 58.5, support 345.82, resistance 376.37. technical analysis of tsla stock. TSLA Stock Gains — full…

Tesla shares traded higher on NASDAQ, with TSLA last changing hands at 375.30 USD after closing at 364.27 USD, a move that leaves the stock pressing against the upper end of its recent range. The message from the chart is straightforward: momentum is still positive, but the price is now close to a technical ceiling where traders often start to test whether the move has real follow-through.
Trend & Price Action
The broader structure remains constructive. Tesla is in an uptrend, and the share price is above the SMA20 at 360.22 and above the SMA50 at 349.60, which means short-term and medium-term averages are both acting as a supportive base rather than a cap. That matters because in technical analysis, prices above rising averages usually signal that buyers remain in control, while the lack of a fresh MA-cross suggests the trend is being extended by price strength rather than a new moving-average signal.
The stock is also trading near the top of its recent band. As shown in the chart, resistance sits at 376.37, while the 20-day support is 345.82. With the price at 375.30, Tesla is sitting at roughly 96% of the 20-day range, which tells readers the market has already done most of the short-term work. That does not automatically mean reversal, but it does mean upside now depends on a clean break through resistance rather than simply drifting higher.
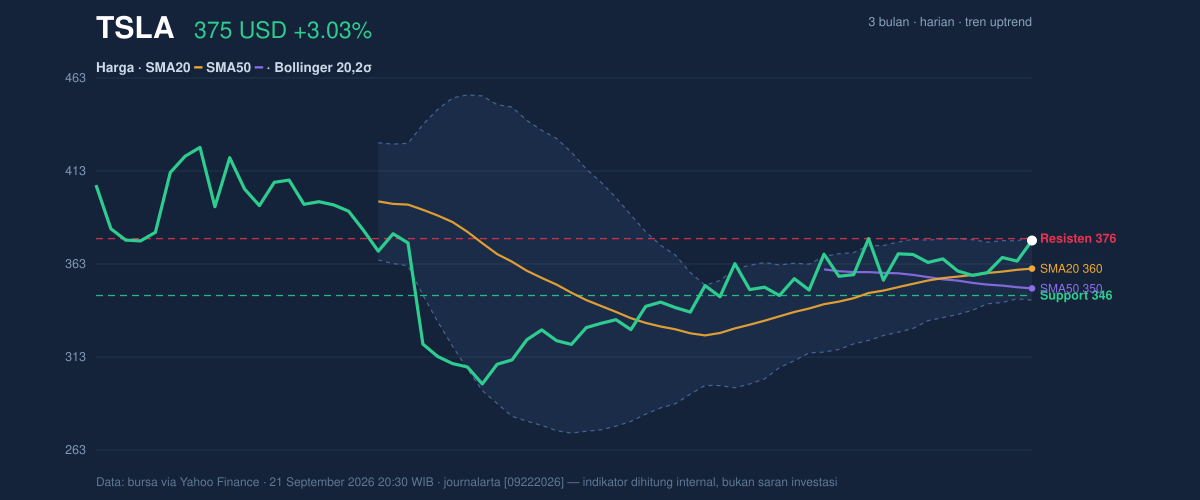
The broader 3-month frame adds context. Tesla is still well below the 3-month high of 432.86, but comfortably above the 3-month low of 297.38. In plain terms, the stock has recovered a meaningful portion of its prior weakness, yet it has not fully escaped the larger trading band.
Oscillators & Momentum
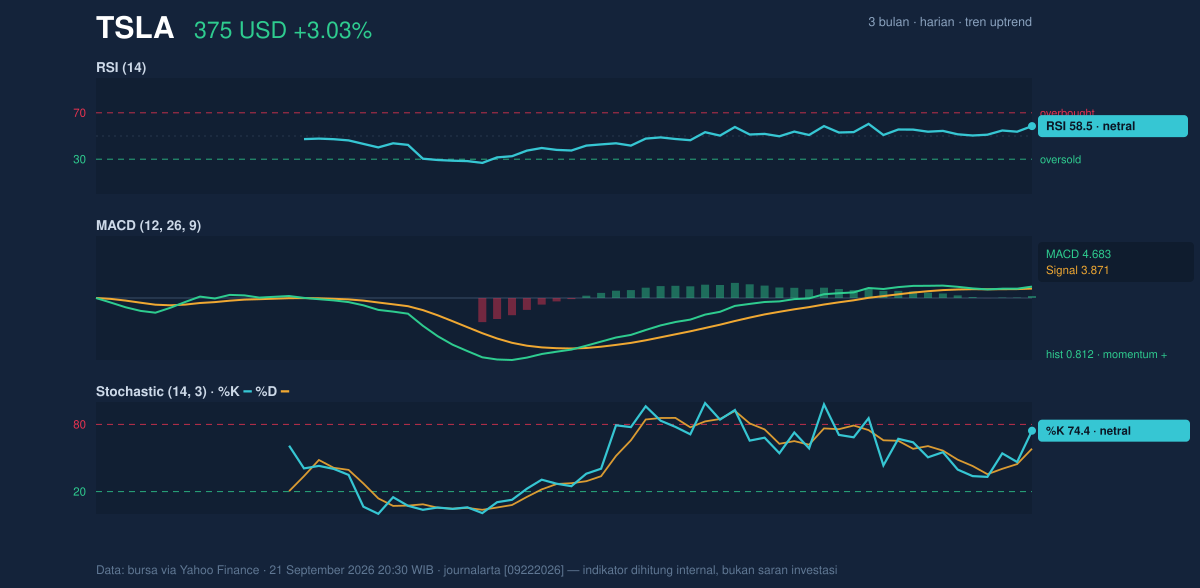
Momentum indicators are supportive, but not overheated enough to call the move exhausted. The RSI at 58.5 is neutral-to-bullish: it says buying pressure is present, but the stock is not in the classic overbought zone where momentum often becomes fragile. The Stochastic reading of 74.4 / 58.3 is also neutral, though the faster line is approaching the upper end of its range. That usually means the recent advance has room to continue, but the market is getting closer to a point where late buyers may be chasing strength.
The clearest signal comes from MACD. With MACD at 4.683, above the signal line at 3.871, and a positive histogram of 0.812, the trend is still gaining traction. The histogram being above zero means the spread between MACD and its signal line is positive; in practice, that suggests the recent push is still supported by momentum rather than fading. This is the kind of setup that often keeps trend traders engaged, even when the oscillator readings themselves are no longer early-stage.
Volatility & Volume
Volatility is not subdued. Tesla’s ATR(14) is 13.66, or 3.6% of price, which signals that the stock can move quickly in either direction on a normal trading day. That matters around resistance: a stock with elevated ATR can pierce a level briefly and still fail, so confirmation is more important than the first touch.
Bollinger Bands add another layer. The upper band is 377.18, the middle band is 360.22, and the lower band is 343.26. With %B at 94%, Tesla is trading very close to the top of its volatility envelope. In simple terms, the stock is stretched toward the upper edge of its recent statistical range. The 9.4% band width is described as normal, which means this is not a squeeze setup waiting to explode from compression; instead, the market is already expanded enough that continuation will need fresh demand.
Volume is less emphatic than the price move. Last volume was 36,439,300, below the 20-day average of 39,345,360, or about 0.9x normal. That tells us the latest advance was not accompanied by a surge of participation. The one constructive offset is that OBV is rising, which suggests the broader accumulation trend remains intact even if the most recent session did not show a volume burst. Put differently, buyers have been present over time, but the latest push has not yet been validated by heavy turnover.
Key Levels & Scenarios
The immediate battle is narrow and clear. Resistance at 376.37 is nearly aligned with the upper Bollinger band at 377.18, making this zone especially important. If Tesla can hold above that area, the next technical message would be that the stock is escaping the top of its recent distribution and may be attempting to reprice higher within the broader trend.
On the downside, support at 345.82 sits just below the SMA20 at 360.22 and the Bollinger middle band, creating a layered support zone. A move back through that area would suggest the current advance has lost momentum and that the market is reverting toward the mid-range rather than building on the breakout attempt.
TSLA last price: 375.30 USD
Immediate resistance: 376.37
Upper Bollinger band: 377.18
Near-term support: 345.82
SMA20: 360.22
SMA50: 349.60
Technical Verdict: HOLD (wait & see)
HOLD (wait & see) fits the current setup because the trend is positive, but the stock is also pressing against resistance at 376.37 with %B at 94%, which means upside is increasingly dependent on a breakout rather than a comfortable trend continuation. The MACD remains positive, and OBV is rising, both of which support the bullish case, but volume is only 0.9x normal, so the latest move lacks strong participation. RSI at 58.5 and Stochastic at 74.4 / 58.3 show momentum is healthy, not overheated, yet close enough to the upper band that follow-through should be confirmed rather than assumed.
- Ideal Entry Range: 360.22 to 376.37, with the cleaner technical zone centered near SMA20 at 360.22 if the stock pulls back without damaging the trend
- Exit Target: 377.18, then any sustained move above resistance at 376.37 would be the next technical confirmation area
- Stop Loss protection: 345.82, the 20-day support that would signal the trend is losing its short-term structure
Verdict invalidated if price breaks below 345.82, because that would mean Tesla has slipped under its nearest support and the current bullish structure is no longer intact.
In plain English, Tesla is still acting strong, but the stock is now close enough to resistance that the market needs to prove it can keep climbing.
Summary Data TSLA
| Last price | 375.30 USD |
| Change 1 day / 5 days / 1 month | 3.03% / 4.55% / 3.43% |
| Trend / MA-cross | uptrend / none |
| SMA20 / SMA50 | 360.22 / 349.60 |
| RSI (14) / Stochastic %K | 58.5 / 74.4 |
| Bollinger %B / ATR | 94% / 13.66 |
| Support / Resistance 20 days | 345.82 / 376.37 |
| Data as of | 21 September 2026 20:30 WIB |



