WMT Stock Gains 0.67% Today, Momentum Gains
On September 22, 2026: price 107.44 USD, trend sideways, RSI 48.2, support 102.63, resistance 109.08. technical analysis of wmt stock. WMT Stock Gains — full…

Walmart is trading in a narrow technical corridor, with the latest move showing mild resilience but not yet enough to overturn a broader sideways pattern. The shares closed at 107.44 USD, up 0.67% on the day, yet still below the 109.78 50-day average, which matters because that longer trend line is often where rallies either gain credibility or stall.
Trend & Price Action
The stock is sitting above the 20-day SMA at 106.24 but below the 50-day SMA at 109.78, a positioning that usually signals balance rather than conviction. In plain terms, the short-term buyers have stabilized the tape, but the medium-term trend has not fully turned in their favor. The chart shows a sideways trend with the 20-day slope still slightly negative at -0.69% over 5 days, so the recent bounce is better read as a recovery inside a range than as a fresh trend break.
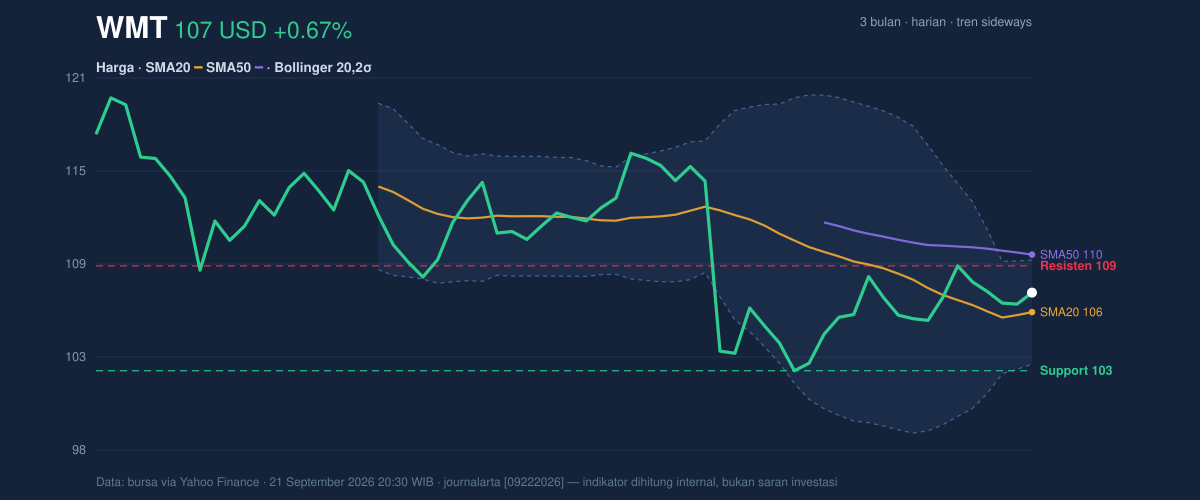
That range is clear in the data. The stock is trading near the upper part of the recent band, with 20-hour support at 102.63 and 20-hour resistance at 109.08, while the 3-month low is 102.15 and the 3-month high is 120.40. Being at 75% of the range tells readers the market is leaning upward inside the box, but not yet at a level that would confirm a larger breakout. The fact that there is no fresh MA cross also matters: there is no new moving-average signal to suggest a durable shift in control.
Oscillators & Momentum
Momentum is mixed, and that is the key reason the setup still reads as neutral rather than bullish. The RSI(14) at 48.2 is almost exactly in the middle of the scale, which means neither overbought enthusiasm nor oversold stress is dominating. The Stochastic %K at 54.7 and %D at 56.8 also sit in neutral territory, showing price is moving, but not with the kind of force that usually accompanies a decisive trend leg.
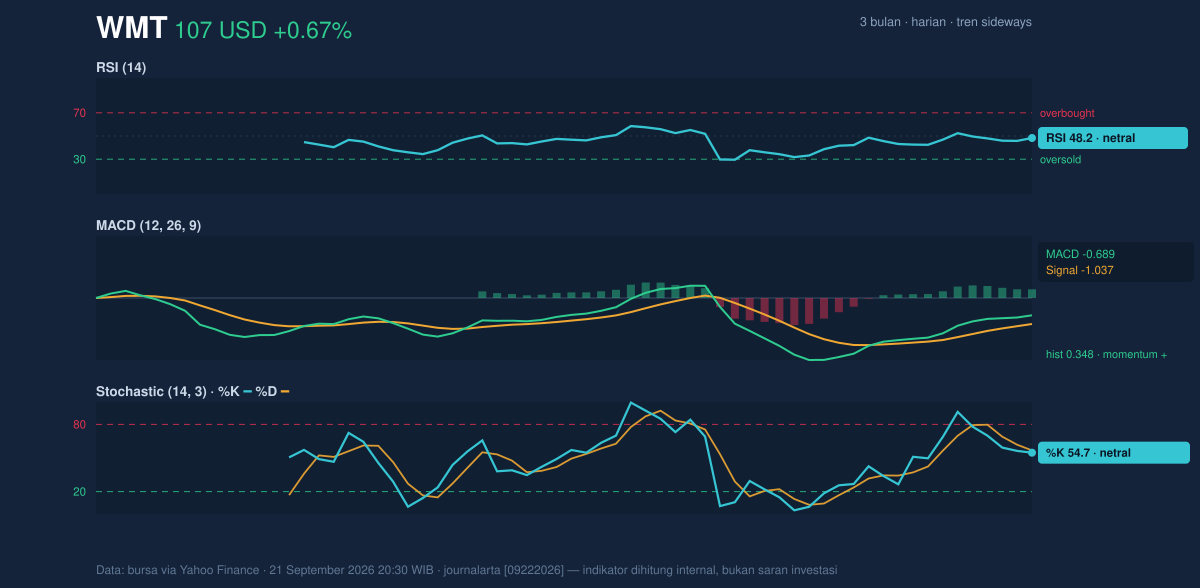
The more constructive signal comes from MACD. The MACD at -0.689 remains below zero, which on its own would normally suggest the broader impulse is still weak. But the signal line at -1.037 is lower, and the histogram at 0.348 is positive. That combination means downside momentum has eased and the short-term trend is improving relative to its recent baseline. In practical terms, the stock is not in a strong breakout mode, but the momentum structure is no longer pointing cleanly lower.
Volatility & Volume
Volatility is moderate, not extreme. The ATR(14) at 1.75, or 1.6% of price, suggests typical daily movement is contained enough for the stock to grind rather than lurch. That matters because a stock in a squeeze can move sharply once it leaves the band, and here the Bollinger Band width is just 6.0%, described in the data as a squeeze. A squeeze does not predict direction, but it does say the market has compressed energy and may be preparing for a larger move than the recent daily range suggests.
The price is also sitting at a %B of 69%, which places it in the upper portion of the Bollinger envelope without reaching the top band at 109.44. That is constructive, but not euphoric. Volume adds a note of caution: the latest print of 23,966,900 shares was roughly 1.0× normal versus the 20-hour average of 24,352,840, so the advance did not come with a surge of participation. Meanwhile, OBV is falling, and that divergence matters because it suggests the recent price stabilization has not yet been matched by strong accumulation.
Key Levels & Scenarios
The immediate technical map is straightforward. 107.44 sits between support at 106.24 and resistance at 109.08, with the Bollinger upper band at 109.44 reinforcing that ceiling. If the stock can push through that area with better volume, the chart would begin to test whether the sideways pattern is giving way to a firmer recovery. If it fails there, the market is likely to remain trapped in the same range, with the lower boundary at 102.63 becoming the level to watch for damage.
The current structure is therefore a waiting game: price is above the short-term average, momentum is improving, but participation is not yet strong enough to confirm a clean upside shift. The OBV decline is the main warning sign, because it says the move has not been fully validated by money flow.
Technical Verdict: HOLD (wait & see)
HOLD (wait & see) because:
- MACD histogram is positive, showing improving momentum, but the MACD line is still below zero.
- Price is above SMA20 yet below SMA50, which keeps the stock in a neutral-to-cautious structure.
- Bollinger Bands are squeezing, signaling a possible breakout, but OBV is declining, so confirmation is lacking.
Verdict invalidated if price falls below 102.63, which would weaken the current range support and reopen the lower end of the 3-month band.
- Ideal Entry Range: 106.24 to 107.44
- Exit Target: 109.08 to 109.44
- Stop Loss Protection: below 102.63
For non-traders, this means the stock is not flashing a clear trend signal yet, and the next meaningful clue is whether it can clear the 109.08 to 109.44 zone or slip back under 102.63.
Summary Data WMT
| Last price | 107.44 USD |
| Change 1 day / 5 days / 1 month | 0.67% / -1.50% / 3.61% |
| Trend / MA-cross | sideways / none |
| SMA20 / SMA50 | 106.24 / 109.78 |
| RSI (14) / Stochastic %K | 48.2 / 54.7 |
| Bollinger %B / ATR | 69% / 1.75 |
| Support / Resistance 20 days | 102.63 / 109.08 |
| Data as of | 21 September 2026 20:30 WIB |


