NVDA Testing Key Resistance: Stock Gains 2.30% (September 22, 2026)
On September 22, 2026: price 227.38 USD, trend sideways, RSI 58.1, support 208.48, resistance 230.36. technical analysis of nvda stock.

Nvidia rose to 227.38 USD on NASDAQ, up 2.30% from the previous close, as the stock pushed deeper into the upper half of its recent trading range. It was a firm session, but not yet a decisive breakout. The chart shows a market that is still being guided by trend support more than by fresh momentum, with price holding above key moving averages while short-term momentum signals stay mixed.
Trend & Price Action
As shown in the chart, Nvidia is trading above both its SMA20 at 219.51 and SMA50 at 214.60, which tells us the medium-term structure remains constructive even though the broader trend is still described as sideways. That matters because a sideways trend with price above both moving averages usually means buyers have enough control to defend dips, but not enough conviction to force a clean trend acceleration.
The lack of a fresh MA-cross also matters. A moving-average cross is often read as a sign of trend change, but here there is no new crossover to confirm a stronger directional move. In plain terms, the stock is still working within an established range rather than breaking into a new phase.
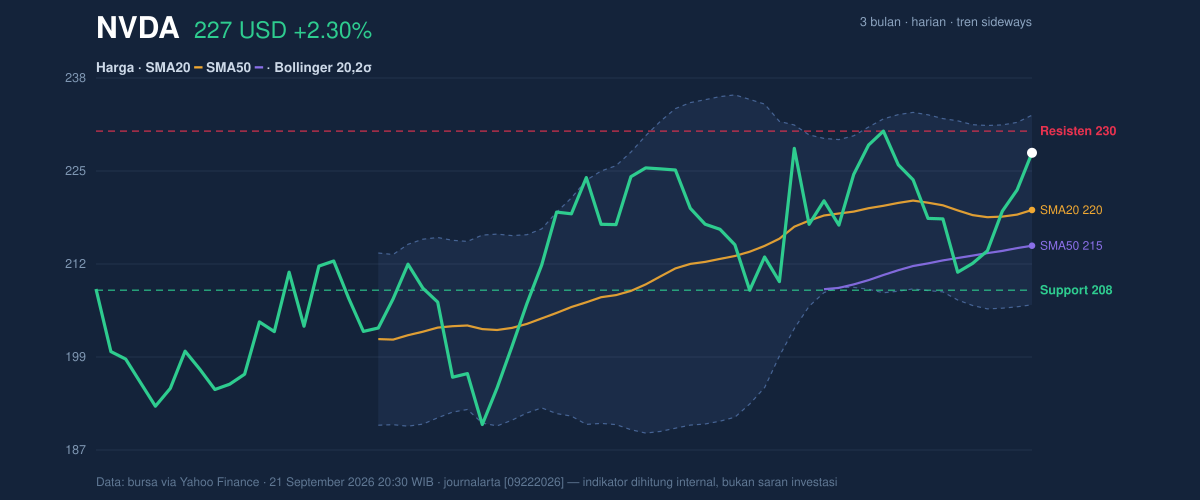
Price is now sitting near the top of the recent band: the 20-hour resistance at 230.36 is close overhead, while the 20-hour support at 208.48 remains the key floor beneath. Trading at roughly 86% of the range means the stock is stretched toward the upper end, which supports the recent advance but also raises the risk of hesitation unless volume expands.
The three-month range adds context. Nvidia’s 3-month high at 234.76 is not far above current levels, while the 3-month low at 189.80 shows how far the stock has already recovered. That recovery is real, but the market still has to prove it can absorb supply near the prior peak.
Oscillators & Momentum
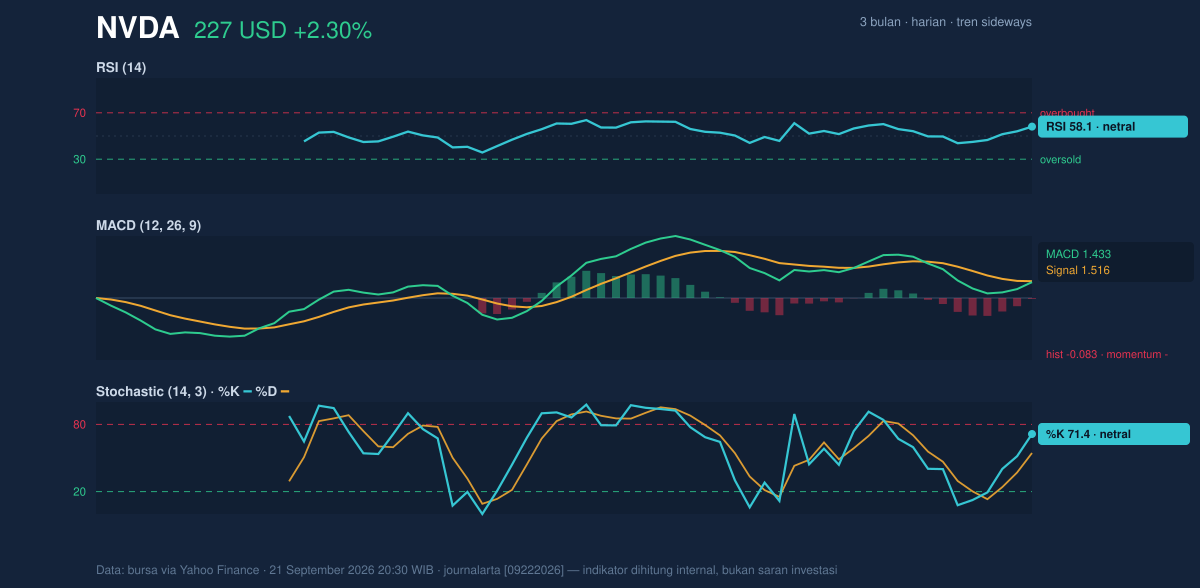
Momentum is mixed rather than cleanly bullish. The RSI at 58.1 is neutral, which means the stock is not overbought and still has room to extend higher if buyers return. The Stochastic %K at 71.4 and %D at 54.5 are also neutral-to-firm, suggesting short-term strength is present but not yet extreme.
The more important signal comes from MACD. The MACD at 1.433 is below its signal line at 1.516, and the histogram at -0.083 is negative. That combination tells readers the recent price lift has not yet been fully confirmed by trend momentum. In practical terms, the stock is rising, but the engine underneath is still idling slightly below the signal line. That can happen near resistance: price advances first, momentum follows later, or it fails and rolls over.
This is why the current setup reads as constructive but incomplete. The oscillators do not show exhaustion, which is positive, but the MACD divergence warns that upside follow-through is not fully validated yet.
Volatility & Volume
Volatility is moderate. The ATR at 6.07, equal to 2.7% of price, suggests daily movement is still meaningful without being unusually violent. That matters because a stock like Nvidia can move quickly when it decides on direction; a mid-range ATR often means the next move will need a catalyst, not just drift.
Bollinger Bands are also useful here. Price is below the upper band at 232.55 and above the middle band at 219.51, with %B at 80%. That reading means the stock is trading near the upper part of its volatility envelope, but not at a clear overextension. The 11.9% band width is normal, so there is no squeeze signaling an imminent breakout, but there is also no wide expansion that would suggest panic or disorder.
Volume was lighter than usual at 109,479,900 versus a 20-day average of 135,230,920, or about 0.8x normal. That is important because a move toward resistance on below-average volume often signals caution: buyers are present, but not yet aggressive enough to force a decisive break. At the same time, OBV is rising, which means the broader flow of volume has still been supportive over time. In other words, participation has not broken down; it is just not surging in this session.
Key Levels & Scenarios
The immediate map is straightforward. 230.36 is the first level to watch on the upside, because it is the nearest resistance and sits just above the current price. If Nvidia can clear that area with better participation, the next reference becomes the 3-month high at 234.76, which is the most visible ceiling in the data.
On the downside, 219.51 is the first important pivot because it is both the SMA20 and Bollinger middle band. A loss of that area would suggest the stock is slipping back toward the center of its range rather than building on the current strength. Below that, 208.48 is the key support line. A break there would weaken the current constructive setup and point back toward the lower part of the recent trading band.
Technical Verdict: HOLD (wait & see)
HOLD (wait & see)
- SMA20 and SMA50 are supportive, so the medium-term structure is still healthy.
- MACD is negative versus its signal line, which means momentum has not fully confirmed the recent price gain.
- Volume is below average, so the move toward resistance lacks strong participation.
Verdict invalidated if price falls below 208.48.
- Ideal Entry Range: 219.51 to 222.27
- Exit Target: 230.36 to 234.76
- Stop Loss protection: below 208.48
In plain English: Nvidia is holding up well, but the chart still needs stronger momentum and volume before the move can be treated as more than a range-bound advance.
The 20-hour resistance sits at 230.36.
Summary Data NVDA
| Last price | 227.38 USD |
| Change 1 day / 5 days / 1 month | 2.30% / 7.78% / 5.90% |
| Trend / MA-cross | sideways / none |
| SMA20 / SMA50 | 219.51 / 214.60 |
| RSI (14) / Stochastic %K | 58.1 / 71.4 |
| Bollinger %B / ATR | 80% / 6.07 |
| Support / Resistance 20 days | 208.48 / 230.36 |
| Data as of | 21 September 2026 20:30 WIB |



