Momentum Weakens, ORCL Stock Gains 0.64% Today
On September 22, 2026: price 148.56 USD, trend sideways, RSI 50.2, support 140.35, resistance 162.52. technical analysis of orcl stock.

Oracle is drifting in the middle of its recent range, with the market still deciding whether the stock’s longer-term uptrend can overcome a short-term loss of momentum.
Oracle shares last traded at 148.56 USD on NYSE, up 0.64% from the previous close of 147.61, according to Yahoo Finance data cited for 21 September 2026 20:30 WIB. That move is modest, but it matters because the stock is sitting just below its SMA20 at 149.52, a short-term average that often acts like a line in the sand for traders watching whether recent strength is being sustained or fading. At the same time, Oracle remains well above its SMA50 at 141.16, which means the broader intermediate trend has not broken down even if the immediate tone is softer.
The stock’s structure is therefore mixed rather than decisive. It is in a sideways trend, and the SMA20 slope is only 0.28% over 5 days, which suggests the market is moving, but not with conviction. In plain English: Oracle is not trending strongly enough to force a breakout narrative, yet it is also not weak enough to imply a clear reversal. The price sits at about 37% of the 20-hour range between 140.35 support and 162.52 resistance, showing it is closer to the lower half of that corridor than the upper edge. That positioning matters because it leaves room for recovery, but also exposes the stock to another test of support if buyers do not step in soon.
Trend & Price Action
The chart, as shown in the price action view, places Oracle below the SMA20 but above the SMA50, a configuration that often signals hesitation rather than a full trend change. There is no new MA-cross, so the moving averages are not delivering a fresh bullish or bearish trigger. Instead, the market is waiting for price to confirm direction. A stock above the longer average but below the shorter one is often in a “decision zone”: the bigger trend still offers some support, but the shorter trend is no longer clearly helping.
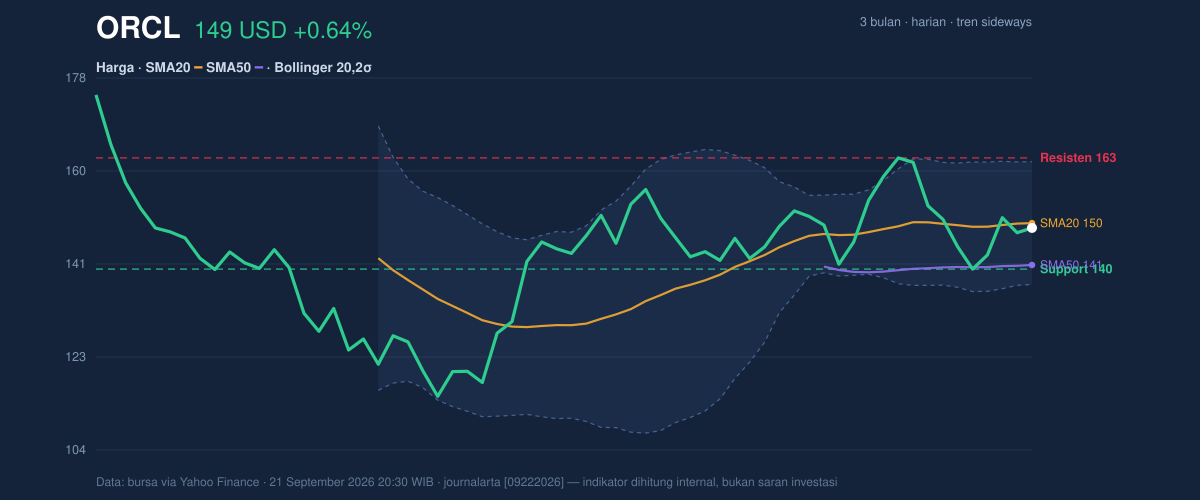
The Bollinger Bands reinforce that reading. Oracle is trading around the middle of the band structure, with the %B at 46%, meaning price is slightly below the band midpoint and not pressing the upper band. The band width is 16.4%, described here as normal, so the market is not in a compression phase that usually precedes an explosive move. That suggests the current range may continue unless a catalyst changes participation.
A short sentence says a lot here: the stock is not breaking out, but it is not breaking down either.
Oscillators & Momentum
The momentum picture is weaker than the price chart alone might suggest. The RSI at 50.2 is neutral, which means Oracle is neither overbought nor oversold. That sounds balanced, but in practice it also means the market has not committed to an aggressive direction. More telling is the Stochastic %K at 30.2 and %D at 31.3, which places the stock near the lower end of neutral territory. Stochastic measures where price sits relative to its recent range; readings around 30 often indicate the stock is close to being oversold, but not yet clearly there.
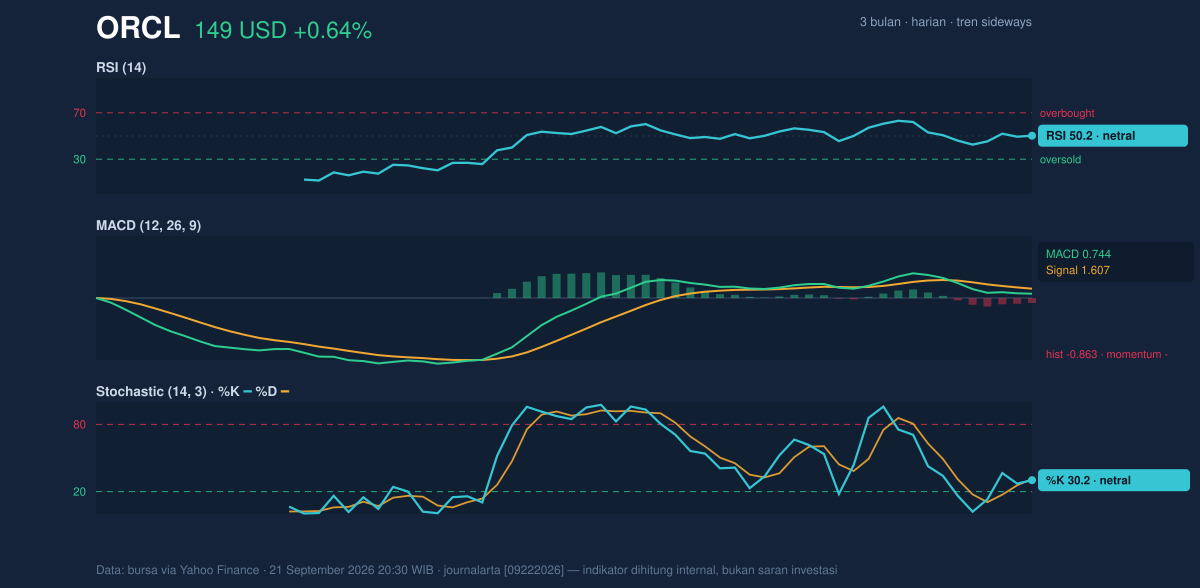
The clearest warning comes from the MACD: the line is at 0.744, below the signal at 1.607, leaving a histogram of -0.863. That negative histogram means short-term momentum is running below its recent trend baseline. In simple terms, the stock may still be stable, but the internal engine is not accelerating. Momentum is not yet bearish enough to imply a collapse, but it is negative enough to make upside progress harder without a pickup in buying interest.
Volatility & Volume
Oracle’s ATR at 8.26, equal to 5.6% of price, shows volatility is relatively high. ATR is a measure of how much a stock typically moves in a session; a higher reading means wider daily swings and more room for false starts around support or resistance. That matters here because the stock is trading inside a range: if it moves, it can move quickly, but the move may also reverse just as fast.
Volume is not confirming a strong directional push. The latest volume of 22,329,400 is only 0.7x normal versus the 20-hour average of 30,445,680, and OBV is falling. OBV, or on-balance volume, tracks whether trading activity is accumulating into the stock or leaving it. A falling OBV while price is still holding up suggests participation is not strongly supporting the current level. That is often a caution flag: price can look steady even while underlying demand weakens.
Key Levels & Scenarios
The market has two obvious reference points: support at 140.35 and resistance at 162.52. Below the current price, the next important cushion is the SMA50 at 141.16, which sits close to support and could attract attention if the stock softens further. Above, the SMA20 at 149.52 is the first hurdle, and the upper Bollinger band at 161.76 sits just beneath the 20-hour resistance zone, highlighting a fairly tight ceiling for now.
If Oracle can reclaim and hold above the 149.52 area, that would improve the short-term tone and reduce the risk that the current move is just a pause within weakness. If it fails to hold 140.35, the chart would start to look more vulnerable because that level is the nearest structural floor in the data provided. The 3-month range of 184.58 high and 114.50 low shows there is still plenty of room above and below, but the stock is currently operating well inside that band rather than at an extreme.
Technical Verdict: HOLD (wait & see)
HOLD (wait & see) fits best because the stock is caught between a longer-term base and a weaker short-term momentum profile.
- Reason 1: price is below the SMA20, which shows near-term softness even though it remains above the SMA50.
- Reason 2: MACD is negative with the histogram at -0.863, signaling momentum is not yet confirming a stronger advance.
- Reason 3: volume is light at 0.7x normal and OBV is falling, so the move lacks strong participation.
- Verdict invalidated if price breaks below 140.35, because that would weaken the current range structure and place the stock closer to a deeper support test.
- Ideal Entry Range: 140.35–149.52
- Exit Target: 161.76–162.52
- Stop Loss protection: below 140.35
For non-traders: Oracle is not showing enough strength to call a clean turn higher, but it is also not weak enough to rule out recovery if support keeps holding.
“Right now, the market is asking Oracle to prove it can do more than just hold the line.”
Summary Data ORCL
| Last price | 148.56 USD |
| Change 1 day / 5 days / 1 month | 0.64% / 2.60% / 1.43% |
| Trend / MA-cross | sideways / none |
| SMA20 / SMA50 | 149.52 / 141.16 |
| RSI (14) / Stochastic %K | 50.2 / 30.2 |
| Bollinger %B / ATR | 46% / 8.26 |
| Support / Resistance 20 days | 140.35 / 162.52 |
| Data as of | 21 September 2026 20:30 WIB |



