INTC Stock Technicals: Drops 8.80% on Monday, RSI Oversold
On November 2, 2026: price 59.97 USD, trend downtrend, RSI 23.0, support 59.97, resistance 113.12. technical analysis of intc stock. INTC Stock Technicals —…

Why INTC is in focus today
- Volume at 1.9× the 20-day average
- Closed at a 20-day low (59.97)
- Trading near its 3-month low (59.40)
- Fresh death cross: SMA20 crossed below SMA50
- RSI(14) at 23.0 — oversold zone
- Downtrend extending (5-day change -33.71%)
Selected automatically from 100 NASDAQ (US) stocks by a technical-signal score with daily weighted randomisation — not a recommendation.
Trend & Price Action
Intel closed at $59.97 on Monday, November 2, down 8.80% for the session, 33.71% over five days and 48.39% over one month, according to the market data. The close matched the 20-day low and sat close to the three-month low of $59.40. That location signals that sellers have driven the stock to the bottom of its recent trading range, rather than merely pushing it back from a short-term peak. The price was below both the 20-day simple moving average, or SMA20, at $93.58 and the 50-day average at $100.50. The SMA20’s steep decline—down 8.98% over five days—shows that the weakness is embedded in the trend, not just in the latest session. A death cross formed three sessions before Monday, when the shorter-term average fell below the longer-term one. It confirms deteriorating price structure, though moving averages respond to past prices and do not by themselves establish what happens next. The Bollinger bands, which frame price against its recent average volatility, were unusually wide at 54.6%. Intel’s close was below the lower band at $68.03, with %B at -16%. A close below the lower band amid widening bands signals unusually strong selling pressure and elevated volatility; it is not, on its own, evidence that a rebound is imminent. As shown in the chart, the price is also at the bottom of the marked 20-day range.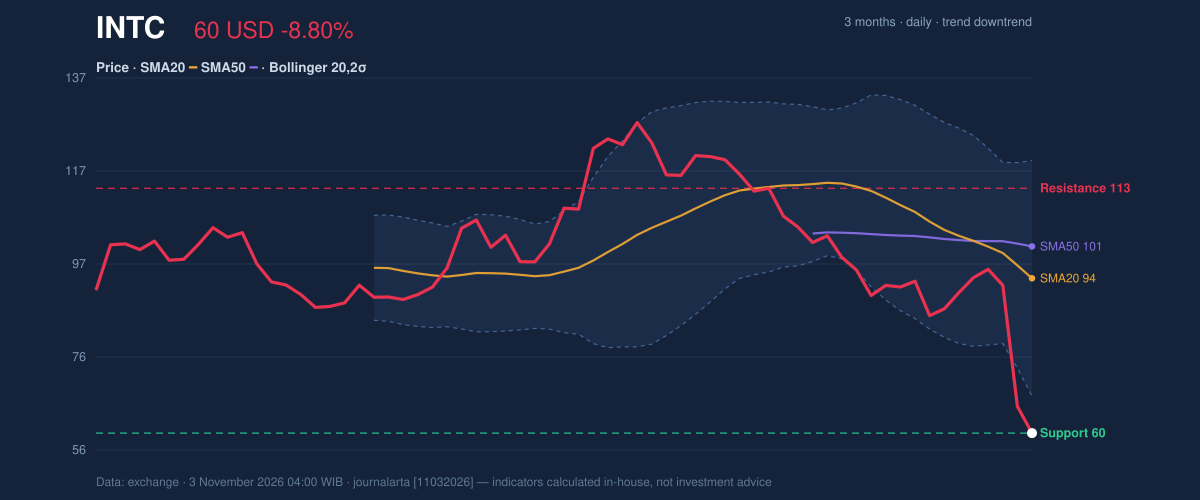
Oscillators & Momentum
The Relative Strength Index (RSI), a gauge of the speed of recent price moves, stood at 23.0, in oversold territory. The Stochastic readings were also deeply oversold: %K was 1.4 and %D was 15.9. These readings describe the scale of the decline; they do not confirm that selling has ended. Oversold conditions can persist when a stock is in a strong downtrend. The Moving Average Convergence Divergence (MACD), a trend-momentum indicator, remained negative at -8.270, below its -5.153 signal line, with a negative histogram of -3.117. That configuration indicates downside momentum remains dominant, despite the oversold readings. The chart brings the RSI, MACD and Stochastic together to show the tension: stretched short-term conditions, but no positive momentum signal in the supplied data.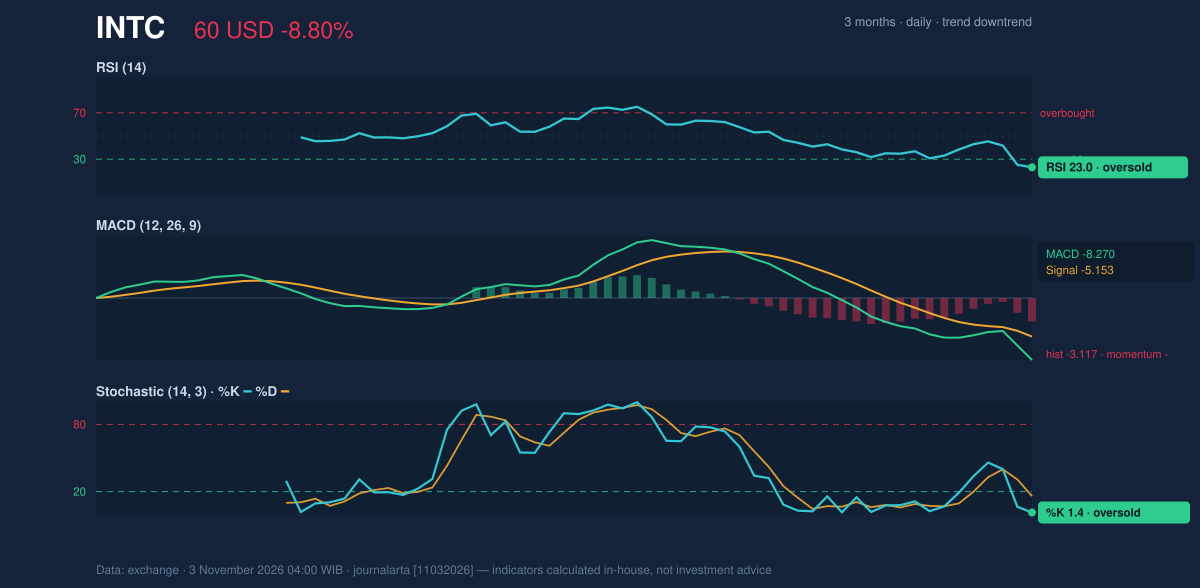
Volatility & Volume
Trading reached 229,466,700 shares, or 1.9 times the 20-day average of 123,787,170. Heavy volume alongside a close at the 20-day low suggests broad participation in the decline, rather than a quiet pullback. On-balance volume (OBV), which tracks whether volume is accumulating on rising or falling sessions, also fell, reinforcing the bearish reading. The average true range (ATR), a measure of typical price movement, was $6.98, equal to 11.6% of the share price. That elevated reading means day-to-day moves are large relative to the stock’s price, making nearby support and resistance less certain as trading boundaries.Key Levels & Scenarios
The immediate reference is support at $59.97, the 20-day low, with the three-month low at $59.40 just below it. A sustained move beneath that area would deepen the breakdown; a failure to hold it would leave $49.50—the price minus 1.5 times ATR—as the supplied lower reference for the bearish setup. On the upside, $70.44, or price plus 1.5 times ATR, is a volatility-based reference, while $113.12 is 20-day resistance. Those levels are far apart, reflecting the exceptional volatility and the distance price has fallen below its averages.Technical Verdict: SELL
The technical bias is bearish, and the indicators support that classification: the death cross formed three sessions earlier; elevated volume accompanied a close at the 20-day low; and falling OBV confirms weak participation. Oversold RSI and Stochastic readings caution that a rebound may occur, but the negative MACD and falling averages offer no confirmation of a reversal. The bearish verdict is invalidated if price breaks above the $113.12 resistance level. - Ideal Entry Range: $59.97–$70.44, using the 20-day support and the price-plus-1.5×ATR reference. - Exit Target: $59.97, the 20-day support; the next reference below it is the three-month low at $59.40. - Stop-Loss Protection: $113.12, the 20-day resistance. In plain English, the chart still points down, but extreme volatility and oversold readings mean the path may be abrupt. | Indicator | Latest reading | |---|---:| | Closing price | $59.97 | | Daily / five-day / one-month change | -8.80% / -33.71% / -48.39% | | SMA20 / SMA50 | $93.58 / $100.50 | | RSI(14) | 23.0 | | Volume / 20-day average | 229,466,700 / 123,787,170 | | Session | Monday, November 2, 2026 |Summary Data INTC
| Last price | 59.97 USD |
| Change 1 day / 5 days / 1 month | -8.80% / -33.71% / -48.39% |
| Trend / MA-cross | downtrend / death |
| SMA20 / SMA50 | 93.58 / 100.50 |
| RSI (14) / Stochastic %K | 23.0 / 1.4 |
| Bollinger %B / ATR | -16% / 6.98 |
| Support / Resistance 20 days | 59.97 / 113.12 |
| Data as of | 3 November 2026 04:00 WIB |
Disclaimer: This technical analysis is generated automatically from exchange data and indicators calculated by JournalArta, for information and education only. The verdict and the entry, target and stop-loss levels are not investment advice or a solicitation to buy or sell any security. Investment decisions and their risks rest solely with the reader.
Track INTC stock price daily: live levels, support/resistance and our full INTC analysis history.