CVX Momentum Gains: Stock Drops 3.29% (November 2, 2026)
On November 2, 2026: price 227.77 USD, trend uptrend, RSI 58.7, support 205.15, resistance 235.52. technical analysis of cvx stock. CVX Momentum Gains — full…
Why CVX is in focus today
- One-day move of -3.29%, about 1.5× its average daily range (ATR)
Selected automatically from 80 NYSE (US) stocks by a technical-signal score with daily weighted randomisation — not a recommendation.
Trend & Price Action
Chevron’s shares lost 1.83% over five sessions but gained 10.32% over the month. The contrast suggests the latest weakness is occurring within a broader advance, rather than erasing it. The price remains above the 20-day simple moving average (SMA), at $222.81, and the 50-day average, at $213.60. The 20-day average itself rose 2.85% over five days, a sign that the short-term trend still points upward. There is no new moving-average crossover. Instead, the technical picture is one of a pullback toward a rising short-term average while the longer average remains lower. The stock sits at 74% of its 20-day range, with resistance at $235.52 and support at $205.15. Its three-month high of $236.48 is close to that resistance, making the area above the current price an important test. The trend remains upward, but Monday’s drop shows that momentum can turn quickly near recent resistance. CVX is still above its rising SMA20 and SMA50, with no fresh crossover to signal a change in trend.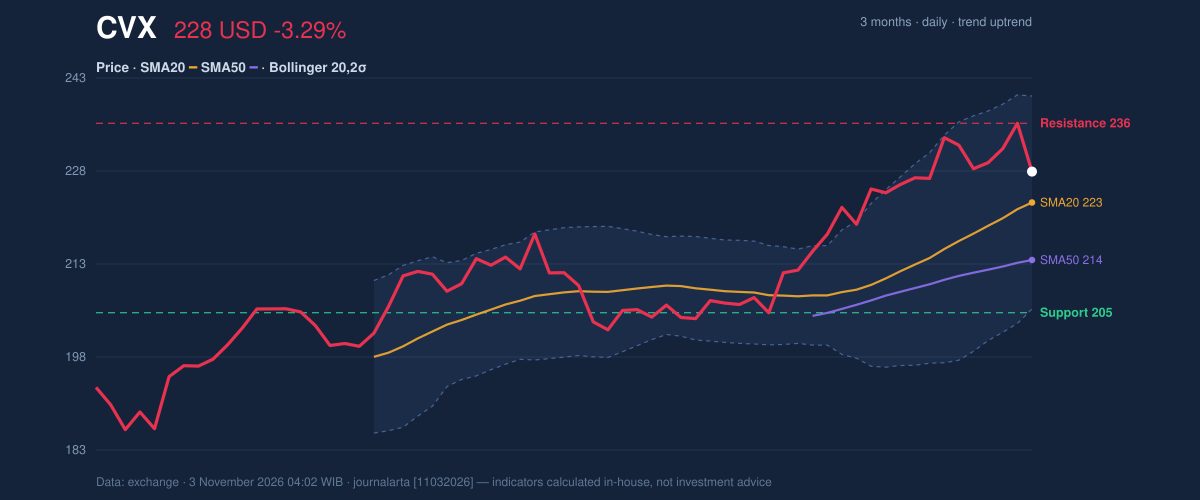
Oscillators & Momentum
The momentum indicators do not give a uniform signal. The relative strength index (RSI), which measures the pace of recent price moves, is 58.7 and classified as neutral. But the data also identifies the RSI as rolling over from above 65, a bearish caution: buying pressure has eased, even though the indicator has not entered oversold territory. The Stochastic readings are also neutral, with %K at 52.7 and %D at 78.4. The gap between the two points to softer near-term momentum, though the readings alone do not establish a confirmed reversal. By contrast, the MACD remains positive: its value is 5.932, above the 5.636 signal line, with a positive 0.296 histogram. In plain terms, the broader momentum measure still favors the upside, but the latest session’s weakness has made that support less conclusive. RSI is neutral at 58.7 but rolling over; Stochastic is neutral, while MACD remains positive.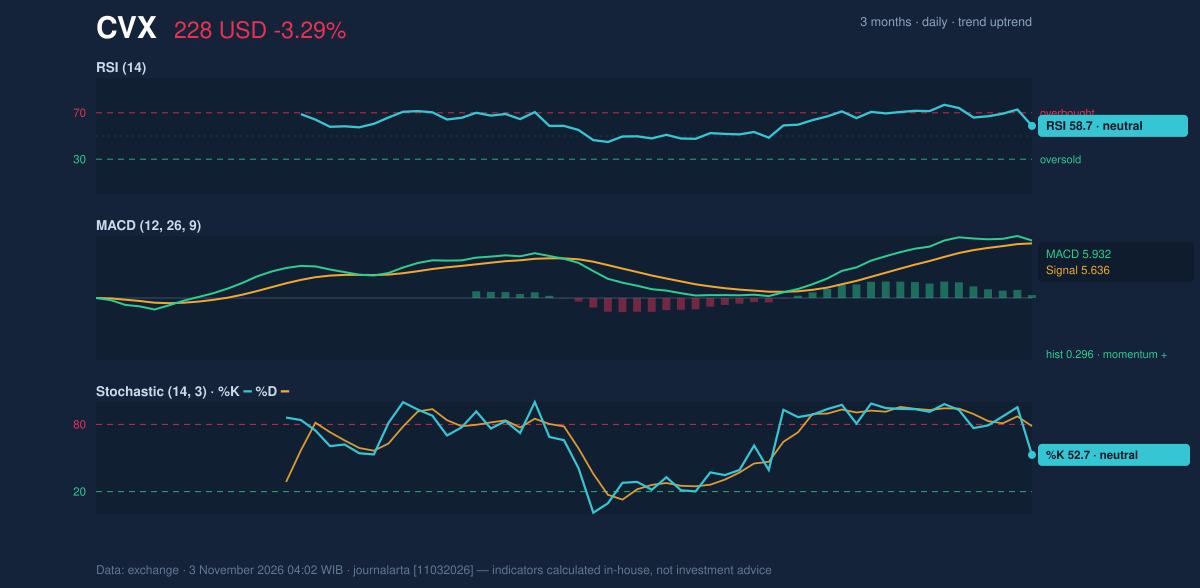
Volatility, Volume & Levels
The Bollinger Bands are at their normal width of 15.3%, rather than showing a squeeze that would point to unusually quiet trading or a marked expansion suggesting exceptional volatility. The price is within the bands, with %B at 65%: above the middle band at $222.81, but not pressed against the upper band at $239.89. The lower band is $205.74. Average true range (ATR), a measure of typical trading movement, is $5.04, or 2.2% of the share price, indicating moderate volatility. Volume was 9,153,200 shares, about 1.2 times the 20-day average of 7,609,440, and on-balance volume (OBV) is rising. Higher-than-usual activity during a decline merits attention, but rising OBV suggests the broader pattern of buying participation has not broken down. The next test is whether CVX can hold near its 20-day average; a sustained move above $235.52 would bring the three-month high of $236.48 into focus. A fall below the $222.81 average would weaken the near-term structure, while the $205.15 support is a deeper reference. Support is $205.15; resistance is $235.52, just below the three-month high of $236.48.Technical Verdict: HOLD (wait & see)
The neutral technical bias fits the mixed evidence. First, price remains above both moving averages and the SMA20 is rising. Second, OBV is rising, supporting the broader uptrend. But RSI rolling over from above 65 and Monday’s outsized decline temper those positives. The verdict is invalidated if price falls below the $205.15 20-day support. - Ideal entry range: $222.81–$227.77, around the SMA20 and last price; this is a technical reference range, not a forecast. - Exit target: $235.52, the 20-day resistance. - Stop-loss protection: $205.15, the 20-day support. For non-traders, the chart still leans upward, but conflicting momentum signals leave the next move unconfirmed.Data Table
| Indicator | Reading |
|---|---|
| Last price | $227.77 |
| Change | 1 day: -3.29% | 5 days: -1.83% | 1 month: +10.32% |
| SMA20 / SMA50 | $222.81 / $213.60 |
| RSI / Stochastic | 58.7 / %K 52.7, %D 78.4 |
| MACD / signal / histogram | 5.932 / 5.636 / 0.296 |
| ATR | $5.04 (2.2%) |
| Support / resistance | $205.15 / $235.52 |
Summary Data CVX
| Last price | 227.77 USD |
| Change 1 day / 5 days / 1 month | -3.29% / -1.83% / 10.32% |
| Trend / MA-cross | uptrend / none |
| SMA20 / SMA50 | 222.81 / 213.60 |
| RSI (14) / Stochastic %K | 58.7 / 52.7 |
| Bollinger %B / ATR | 65% / 5.04 |
| Support / Resistance 20 days | 205.15 / 235.52 |
| Data as of | 3 November 2026 04:02 WIB |
Disclaimer: This technical analysis is generated automatically from exchange data and indicators calculated by JournalArta, for information and education only. The verdict and the entry, target and stop-loss levels are not investment advice or a solicitation to buy or sell any security. Investment decisions and their risks rest solely with the reader.
Track CVX stock price daily: live levels, support/resistance and our full CVX analysis history.