Testing Key Resistance, KO Stock Gains 1.86% on Monday
On November 2, 2026: price 95.83 USD, trend uptrend, RSI 67.1, support 85.82, resistance 95.83. technical analysis of ko stock. Testing Key Resistance — full…
Why KO is in focus today
- Trading near its 3-month high (96.26)
- Uptrend confirmed (5-day change 3.38%)
Selected automatically from 80 NYSE (US) stocks by a technical-signal score with daily weighted randomisation — not a recommendation.
Trend & Price Action
KO is above its 20-day average of $91.57 and its 50-day average of $89.56. The 20-day average rose 1.92% over five days, reinforcing the upward trend rather than showing a flat or weakening base. There has been no new moving-average crossover, however, so the signal comes from the shares’ position above both averages and the rising short-term trend, not from a fresh crossover. The stock’s 1.86% one-day rise and 10.77% one-month gain have carried it to the top of its 20-day trading range: $95.83 is both the latest price and the stated 20-day resistance. It is also close to the three-month high of $96.26. A break above that high would extend the range; a failure at resistance could instead leave the price testing whether recent gains can hold.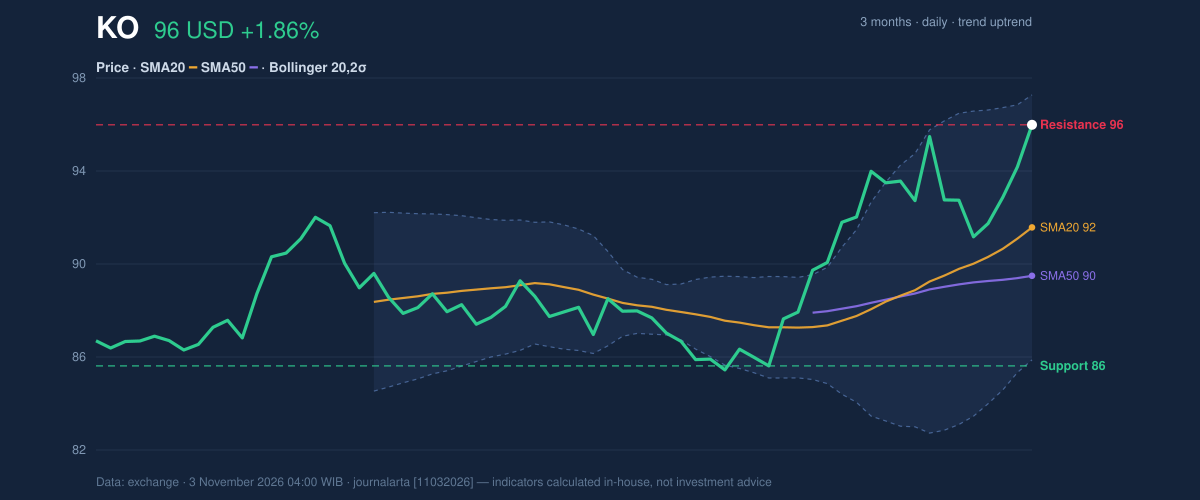
Oscillators & Momentum
The momentum indicators are positive, but not uniformly comfortable. MACD stands at 1.493 against a 1.292 signal line, with a positive 0.201 histogram. In plain terms, recent upward momentum remains stronger than its slower comparison line. RSI is 67.1 and classified as neutral in the supplied data, rather than already overbought. Stochastic %K at 92.5 and %D at 77.7 are overbought. That reading does not by itself establish a reversal; it indicates that the recent rise has been strong enough to leave the price vulnerable to a pause or pullback. As shown in the momentum chart, the contrast between positive MACD and an overbought Stochastic is a reason to distinguish trend strength from near-term stretch.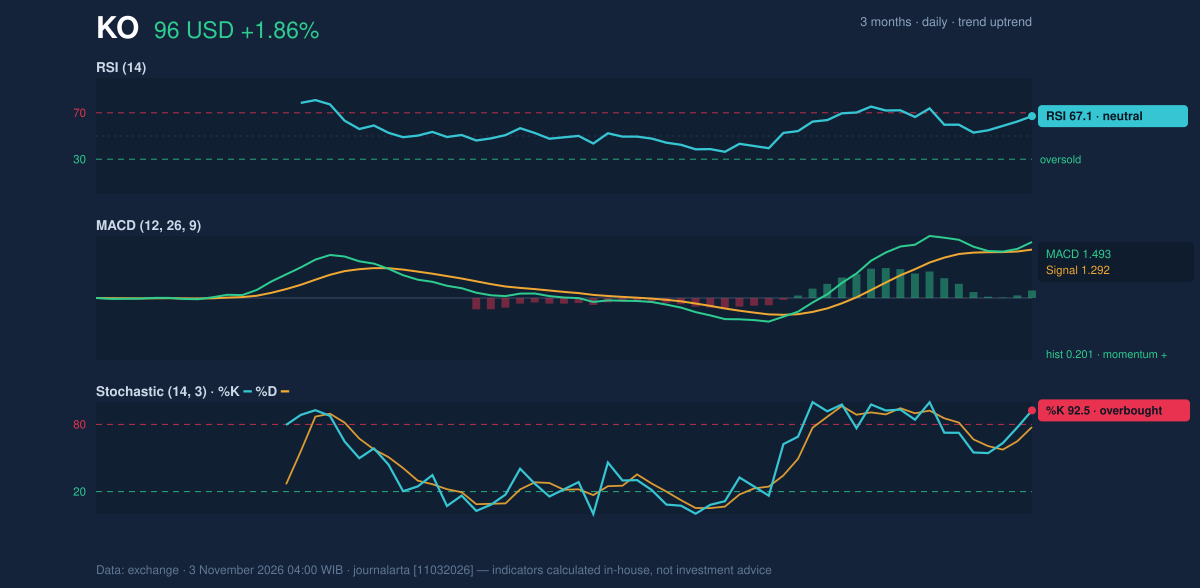
Volatility & Volume
Trading volume reached 22,669,400 shares, or 1.4 times the 20-session average of 16,734,305. OBV is rising as well. OBV, which tracks whether volume is accumulating on rising sessions or receding on falling ones, points here to participation supporting the advance rather than a rally on thinning activity. The Bollinger Bands are at normal width, not squeezed or sharply expanding. The price is at 89% of the band’s range, with the upper band at $97.07 and the lower at $86.07. This places KO near the upper boundary without showing an unusually narrow setup that would signal compression before a larger move. ATR is $1.85, equivalent to 1.9% of the price, indicating moderate day-to-day volatility rather than a particularly calm or turbulent market.Key Levels & Scenarios
The immediate test is the $95.83 20-day resistance, followed by the $96.26 three-month high. A sustained move above the three-month peak would put the upper Bollinger Band at $97.07 in view as the next reference level in the supplied data. If the stock fails to hold near resistance, $93.05—the price minus 1.5 times ATR—offers a nearer volatility-based reference, while the 20-day average at $91.57 marks a deeper trend reference. The main structural support is $85.82, the 20-day support; the three-month low is $85.13. Those levels sit well below the latest price, so a retreat to them would mean a significant break from the current range, not an ordinary small fluctuation.Technical Verdict: HOLD
HOLD (wait & see) matches the supplied neutral technical bias. Rising OBV confirms participation in the uptrend, and MACD remains positive; against that, the share price is at 20-day resistance and Stochastic is overbought. The evidence supports a strong trend but does not yet settle whether KO can clear its three-month peak. - Ideal entry range: $91.57–$93.05, using the 20-day average and the price-minus-1.5-ATR reference as chart-based levels, not a forecast. - Exit target: $96.26, the three-month high; a move above it would change that reference point. - Stop-loss protection: $85.82, the 20-day support. - Invalidation condition: The neutral reading is invalidated if the price breaks below $85.82. For non-traders, the trend is rising, but the stock is pressing against a ceiling and its short-term momentum is stretched, so the signals remain mixed. | Indicator | Latest reading | |---|---:| | Last price | $95.83 | | Change | 1 day: 1.86% · 5 days: 3.38% · 1 month: 10.77% | | SMA20 / SMA50 | $91.57 / $89.56 | | RSI(14) | 67.1, neutral | | Stochastic %K / %D | 92.5 / 77.7, overbought | | MACD / signal / histogram | 1.493 / 1.292 / 0.201 | | Bollinger upper / middle / lower | $97.07 / $91.57 / $86.07 | | ATR(14) | $1.85 | | Volume / 20-session average | 22,669,400 / 16,734,305 | | Support / resistance (20 sessions) | $85.82 / $95.83 | | Three-month low / high | $85.13 / $96.26 |Summary Data KO
| Last price | 95.83 USD |
| Change 1 day / 5 days / 1 month | 1.86% / 3.38% / 10.77% |
| Trend / MA-cross | uptrend / none |
| SMA20 / SMA50 | 91.57 / 89.56 |
| RSI (14) / Stochastic %K | 67.1 / 92.5 |
| Bollinger %B / ATR | 89% / 1.85 |
| Support / Resistance 20 days | 85.82 / 95.83 |
| Data as of | 3 November 2026 04:00 WIB |
Disclaimer: This technical analysis is generated automatically from exchange data and indicators calculated by JournalArta, for information and education only. The verdict and the entry, target and stop-loss levels are not investment advice or a solicitation to buy or sell any security. Investment decisions and their risks rest solely with the reader.
Track KO stock price daily: live levels, support/resistance and our full KO analysis history.