PM Stock Analysis: Drops 0.24%, Testing Key Resistance
On November 2, 2026: price 208.29 USD, trend uptrend, RSI 63.6, support 190.40, resistance 208.79. technical analysis of pm stock. PM Stock Analysis — full…

Why PM is in focus today
- Uptrend confirmed (5-day change 3.18%)
Selected automatically from 80 NYSE (US) stocks by a technical-signal score with daily weighted randomisation — not a recommendation.
Trend & Price Action
The five-day gain is part of a broader advance: PM rose 9.90% over one month, and its 20-day moving average climbed 2.05% over five days. The share price sits above both the 20-day average at $201.45 and the 50-day average at $194.54, a structure consistent with an established uptrend rather than a short-lived bounce. No new moving-average crossover has formed, so the signal is continuation, not a fresh technical turning point. But the advance has brought the stock close to a ceiling. At $208.29, PM is at 97% of its 20-session range, with resistance at $208.79; the three-month high is $214.35. That position matters because a stock near the top of its recent range may need stronger demand to keep advancing. As shown in the chart, the price is also approaching the upper Bollinger band at $210.55.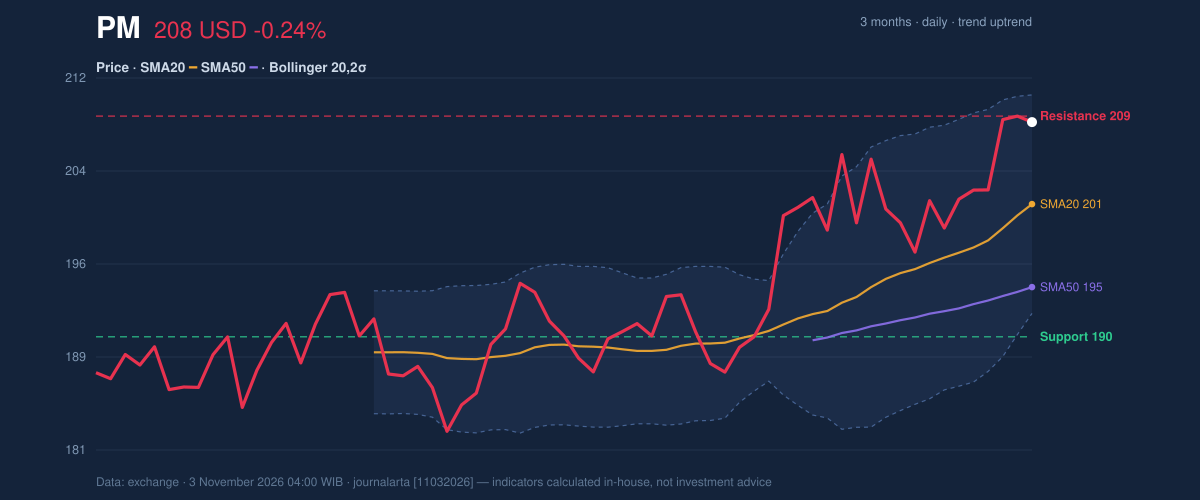
Oscillators & Momentum
Momentum indicators are positive, but not uniformly comfortable. The MACD histogram is positive at 0.559, with MACD at 3.659 above its 3.100 signal line. This points to upward momentum: recent price movement is strengthening relative to the signal line, though it does not guarantee that gains will continue. The RSI is 63.6, in neutral territory, suggesting upward pressure without an RSI-based overbought warning. The Stochastic tells a more cautious story: %K at 80.0 and %D at 84.8 are overbought. This oscillator compares a recent close with its price range; a high reading can mean the rally has stretched, not that a reversal is certain. Together, the indicators show positive momentum alongside a greater risk of a pause near resistance.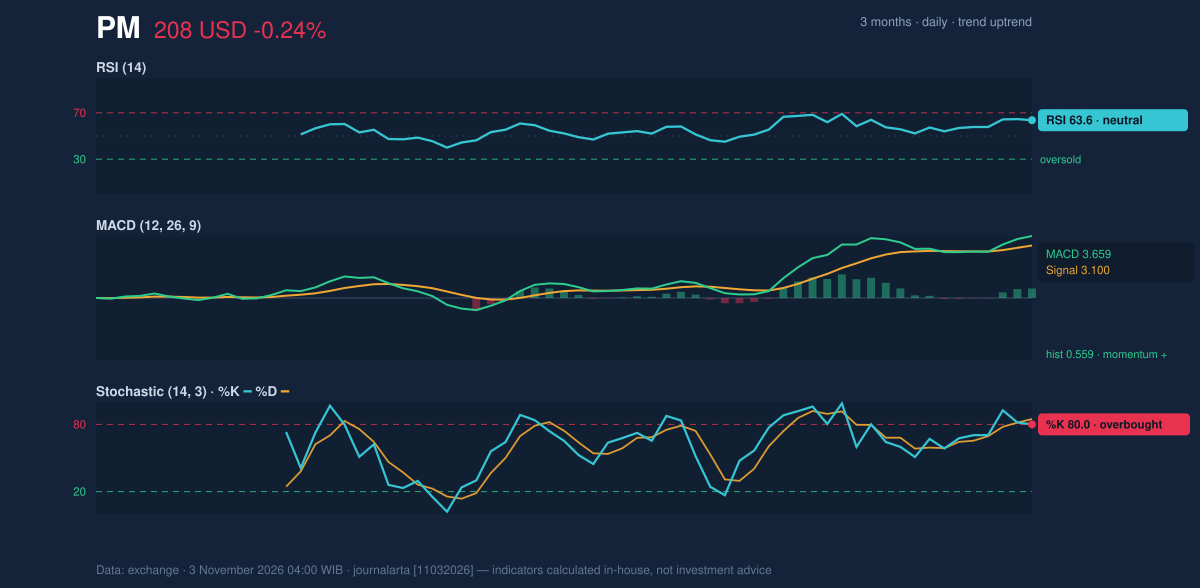
Volatility, Volume & Levels
The Bollinger reading reinforces the need to distinguish strength from room to run. PM’s %B is 88%, placing the price near the upper band, while the 9.0% band width is described as normal rather than unusually compressed or expanded. That does not signal an extreme volatility breakout. ATR is $5.89, or 2.8% of the share price, indicating moderate typical price movement. Participation supports the uptrend: volume was 5,098,700 shares, 1.1 times the 20-session average, and on-balance volume (OBV)—a running measure of whether volume accompanies rising or falling prices—is rising. That gives the advance more confirmation than price alone. Still, resistance at $208.79 and the three-month high at $214.35 frame the immediate test. A sustained move above the nearer resistance would put the high in focus; failure to hold the 20-day average at $201.45 would weaken the near-term structure. The wider 20-session support is $190.40, with the three-month low at $181.01.Technical Verdict: BUY
The technical bias is bullish, with three of seven signals on the bullish side and none on the bearish side. The strongest supporting signals are the positive MACD histogram, the share price holding above the 50-day average within an uptrend, and rising OBV. The overbought Stochastic and nearby resistance argue for caution, but do not outweigh that configuration under the stated signal framework. - Ideal entry range: $201.45–$208.79, bounded by the 20-day average and 20-day resistance. - Exit target: $214.35, the next resistance represented by the three-month high if PM clears $208.79. - Stop-loss protection: $190.40, the 20-day support. - Invalidation: The verdict is invalidated if the price falls below $190.40. For non-traders, the chart signals that the upward trend remains intact, although the share price is close to resistance and could pause.Summary Data PM
| Last price | 208.29 USD |
| Change 1 day / 5 days / 1 month | -0.24% / 3.18% / 9.90% |
| Trend / MA-cross | uptrend / none |
| SMA20 / SMA50 | 201.45 / 194.54 |
| RSI (14) / Stochastic %K | 63.6 / 80.0 |
| Bollinger %B / ATR | 88% / 5.89 |
| Support / Resistance 20 days | 190.40 / 208.79 |
| Data as of | 3 November 2026 04:00 WIB |
Disclaimer: This technical analysis is generated automatically from exchange data and indicators calculated by JournalArta, for information and education only. The verdict and the entry, target and stop-loss levels are not investment advice or a solicitation to buy or sell any security. Investment decisions and their risks rest solely with the reader.
Track PM stock price daily: live levels, support/resistance and our full PM analysis history.