MCD Stock Analysis: Gains 2.91%, RSI Overbought
On November 2, 2026: price 265.64 USD, trend sideways, RSI 74.4, support 230.88, resistance 265.64. technical analysis of mcd stock. MCD Stock Analysis — full…

Why MCD is in focus today
- One-day move of 2.91%, about 1.5× its average daily range (ATR)
- RSI(14) at 74.4 — overbought zone
Selected automatically from 80 NYSE (US) stocks by a technical-signal score with daily weighted randomisation — not a recommendation.
Trend & Price Action
McDonald’s is trading above its 20-day average of $244.96, while its 50-day average is $248.17. The averages remain close, and the absence of a new crossover tempers the bullish message from the recent gains. The 20-day resistance is $265.64—the current price—placing the stock at the top of its 20-day range. Its three-month high of $278.37 remains the next broader reference point. The price has moved beyond the upper Bollinger Band at $263.18. Bollinger Bands track how far a price has moved from its recent average; a reading above the upper band can signal an unusually strong move, but it does not by itself establish that the rise will continue. The band width is 14.9%, classified as normal rather than unusually compressed or expanded.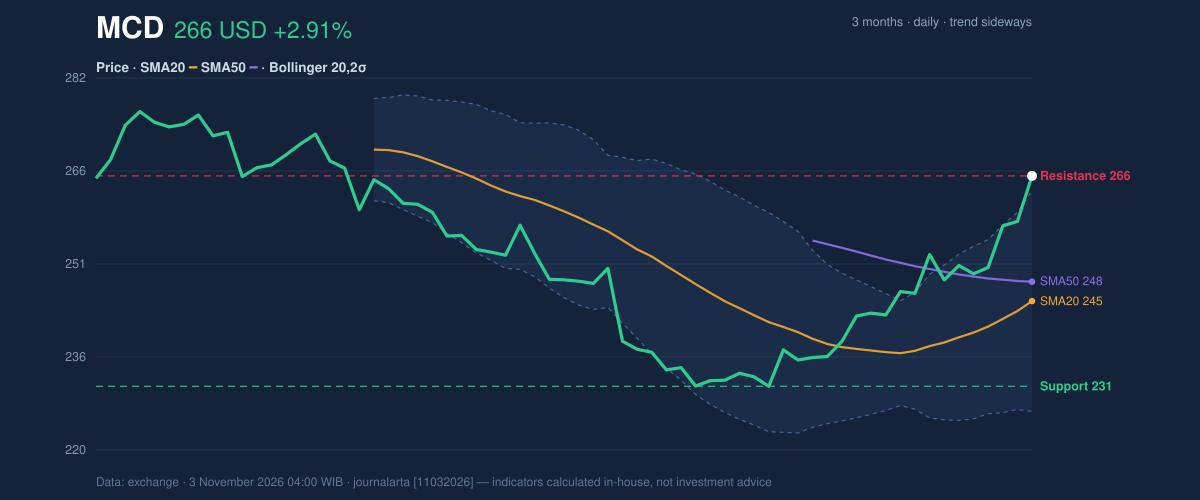
Oscillators & Momentum
Momentum indicators confirm the strength of the move, while also warning that it may be difficult to sustain at the same pace. The RSI is 74.4, in overbought territory, a reading that indicates a sharp recent advance rather than a guarantee of an immediate reversal. The Stochastic is also overbought, with %K at 99.9 and %D at 94.1, showing that the close is near the top of its recent price range. The MACD, a measure of the relationship between short- and longer-term price momentum, remains positive: it stands at 3.913 against a signal line of 1.179, with a histogram of 2.734. This supports the case that upward momentum is still present. But the gap between strong momentum and overbought readings matters: the indicators show buyers have driven the advance, not that the stock has cleared the risk of a pullback.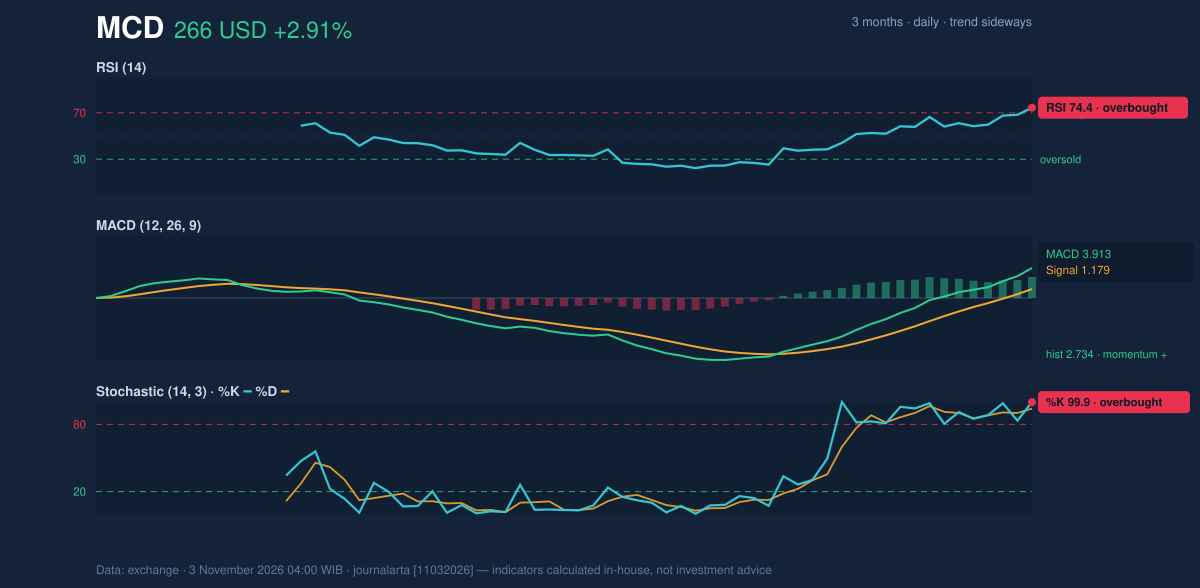
Volatility, Volume & Key Levels
Trading volume reached 6,472,000 shares, about 1.2 times the 20-day average of 5,491,910, while on-balance volume (OBV), which tracks whether volume is flowing with price gains or losses, is rising. That lends some confirmation to the advance: the move was accompanied by greater-than-normal participation. The 14-day average true range, a measure of typical price movement, is $5.13, or 1.9% of the share price—moderate volatility by the supplied reading. The key near-term test is whether the stock can hold above its current resistance reference. A move toward the three-month high at $278.37 would extend the advance, but the data do not establish a breakout. If momentum cools, $257.95—the price minus 1.5 times ATR—offers a volatility-based reference; the more distant 20-day support is $230.88. The three-month low is $229.20. These are levels to monitor, not assurances that prices will stop or turn there.Technical Verdict: HOLD (wait & see)
The neutral technical bias supports a wait-and-see reading. Three signals explain the balance: - The RSI at 74.4 and Stochastic at 99.9/94.1 are overbought, raising the risk that the short-term advance is stretched. - The MACD is positive, and rising OBV with volume at 1.2 times its 20-day average shows participation behind the move. - The price is above the 20-day average, but no new moving-average crossover has formed; it has also reached the 20-day resistance and is above the upper Bollinger Band. The neutral verdict is invalidated on the downside if the price falls below the 20-day support at $230.88. - Ideal Entry Range: $257.95–$265.64, using the ATR-based reference and 20-day resistance. - Exit Target: $278.37, the three-month high. - Stop Loss: Below $230.88, the 20-day support. For non-traders, the indicators show a strong but increasingly stretched rise, with no clear technical signal yet favoring either direction.| Indicator | Reading |
|---|---|
| Latest price | $265.64 |
| Price change | 1 day: 2.91% | 5 days: 5.90% | 1 month: 13.99% |
| SMA20 / SMA50 | $244.96 / $248.17 |
| Bollinger Bands | Upper $263.18 | Middle $244.96 | Lower $226.74 | %B 107% |
| RSI / Stochastic | 74.4 | %K 99.9 / %D 94.1 |
| MACD | 3.913 | Signal 1.179 | Histogram 2.734 |
| ATR / volume | $5.13 | 6,472,000 shares |
| Support / resistance | $230.88 / $265.64 |
| Three-month high / low | $278.37 / $229.20 |
| Technical bias | Neutral |
Summary Data MCD
| Last price | 265.64 USD |
| Change 1 day / 5 days / 1 month | 2.91% / 5.90% / 13.99% |
| Trend / MA-cross | sideways / none |
| SMA20 / SMA50 | 244.96 / 248.17 |
| RSI (14) / Stochastic %K | 74.4 / 99.9 |
| Bollinger %B / ATR | 107% / 5.13 |
| Support / Resistance 20 days | 230.88 / 265.64 |
| Data as of | 3 November 2026 04:00 WIB |
Disclaimer: This technical analysis is generated automatically from exchange data and indicators calculated by JournalArta, for information and education only. The verdict and the entry, target and stop-loss levels are not investment advice or a solicitation to buy or sell any security. Investment decisions and their risks rest solely with the reader.
Track MCD stock price daily: live levels, support/resistance and our full MCD analysis history.