INTC Stock Gains 1.91% on Wednesday, Death Cross Pressure
On October 28, 2026: price 95.53 USD, trend downtrend, RSI 45.6, support 85.49, resistance 120.00. technical analysis of intc stock. INTC Stock Gains — full…
Why INTC is in focus today
- Fresh death cross: SMA20 crossed below SMA50
- Not covered by JournalArta in the last 14 days
Selected automatically from 32 NASDAQ (US) stocks by a technical-signal score with daily weighted randomisation — not a recommendation.
Trend & Price Action
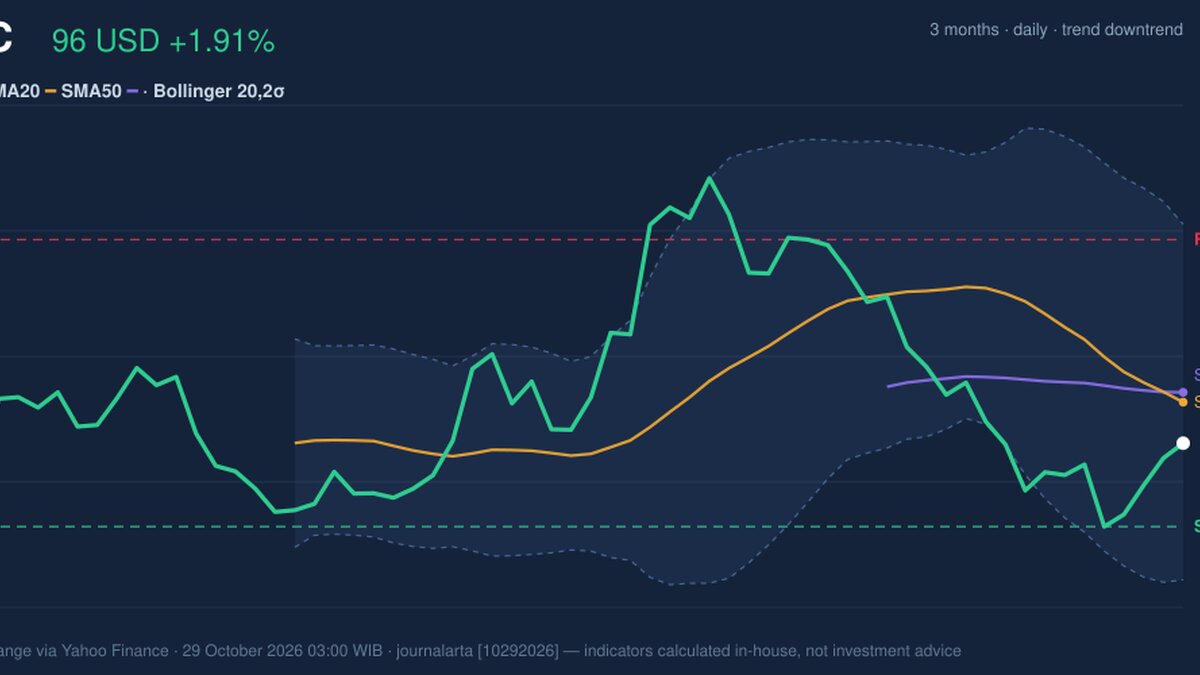
Intel gained 2.76% over five days, yet fell 20.54% over one month. The contrast points to a short-term bounce within a much weaker monthly pattern. At $95.53, the stock is below its 20-day average of $100.46 and its 50-day average of $101.65; the averages’ positions suggest sellers have had the broader advantage. The 20-day average fell 6.96% over five days, reinforcing the downtrend. Its latest cross beneath the 50-day average adds a bearish signal because the shorter-term trend has weakened relative to the longer one. That does not settle what happens next: price has risen over five days, and the indicator can lag actual trading. As shown in the chart, Intel is in the lower part of its 20-day support-to-resistance range, at 29% of the distance from support to resistance. The three-month high and low were $127.44 and $81.79, respectively, placing the latest price closer to the low than the high.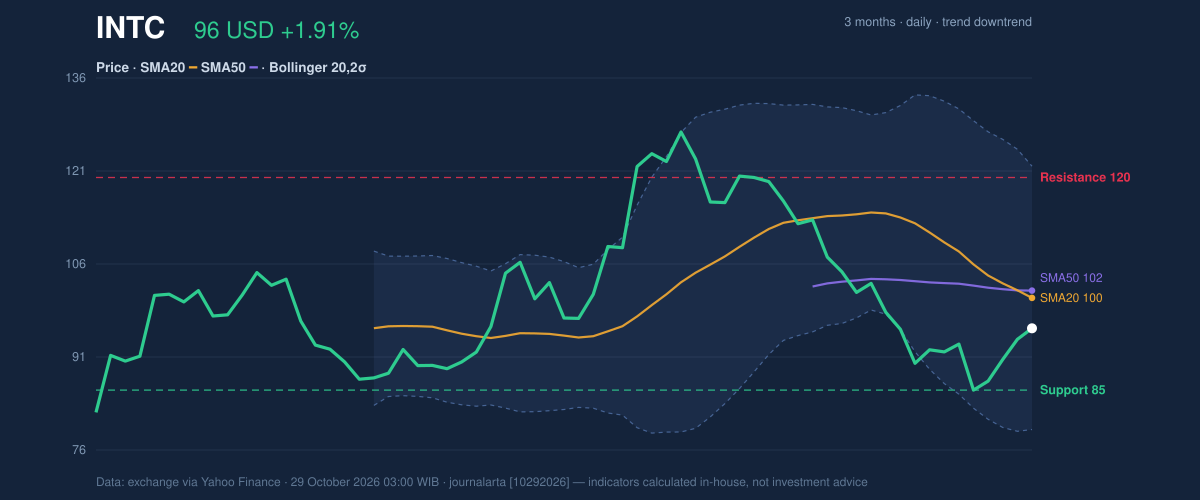
Oscillators & Momentum
The momentum indicators give a mixed, but not strongly bullish, reading. RSI is neutral at 45.6; the Relative Strength Index gauges the pace of recent gains and losses, and this reading is neither an oversold signal nor evidence of strong upward momentum. Stochastic %K at 45.8 and %D at 32.9 are also neutral, offering no clear confirmation that the recent bounce has become a durable reversal. The MACD points more firmly downward. MACD is -4.463, below its -3.650 signal line, with a -0.813 histogram. MACD compares short- and longer-term price momentum; a negative reading below the signal line indicates that downward momentum still has the upper hand. The gap between this bearish signal and the five-day gain matters: the price recovery has not yet been matched by a positive momentum reading.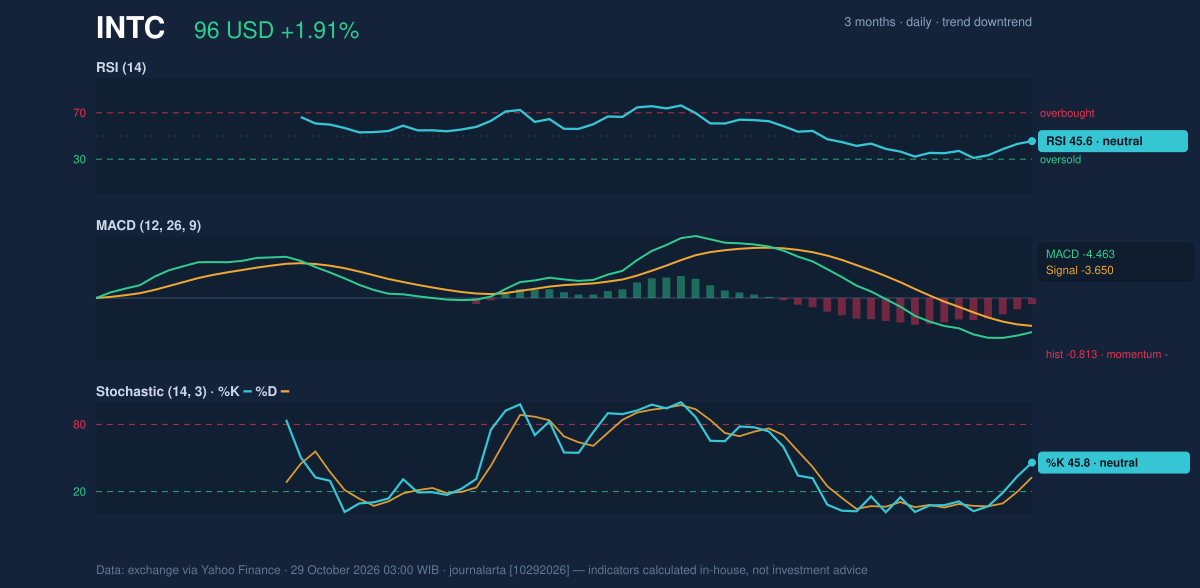
Volatility & Volume
Intel’s Bollinger Bands are wide, a sign that recent price swings have been unusually large. The bands span $79.10 to $121.83, with a width of 42.5%; the middle line, which is the 20-day average, is $100.46. The 38% %B reading places price below the band midpoint but above the lower band. %B measures where the price sits within the bands, so this reading shows weakness relative to the recent range without indicating that shares are at the band’s lower edge. The Average True Range, a measure of typical trading movement, is $5.06, or 5.3% of the share price. That elevated reading underscores the potential for sharp moves in either direction; it is not a forecast of which direction will prevail. Volume was 81,862,000 shares, about 0.8 times the 20-session average of 96,803,565. Participation was therefore below normal during the latest advance, which limits how much confirmation the bounce receives from trading activity. On the other hand, OBV, a measure that tracks whether volume is flowing into or out of a stock, is rising. That provides a counterpoint to the falling averages, but does not erase the negative MACD signal.Key Levels & Scenarios
Support is $85.49 and resistance is $120.00, based on the 20-session levels. A move toward resistance would need to overcome the 20-day and 50-day averages clustered near $100–$102 first. If price can regain those averages, the current short-term rebound would have stronger evidence behind it. If it fails to hold and moves toward support, the downtrend would remain consistent with the falling 20-day average and negative MACD. The three-month low of $81.79 provides additional historical context, but it is not the stated 20-session support level. The wide bands and 5.3% ATR make these levels reference points, not guarantees; large daily swings can complicate attempts to read a break or hold in isolation.Technical Verdict: HOLD
HOLD (wait & see) reflects conflicting signals rather than a confirmed reversal. The death cross and negative MACD argue that downside momentum remains in control, while the five-day gain and rising OBV leave room for the rebound to continue. Neutral RSI and Stochastic readings provide no strong confirmation either way. - Ideal entry range: $85.49–$100.46, between 20-session support and the 20-day average. - Exit target: $120.00, the 20-session resistance. - Stop-loss protection: $79.10, the lower Bollinger Band. - Invalidation: The HOLD view is invalidated if price falls below $85.49, the stated 20-session support. For non-traders, the indicators are divided: Intel has bounced, but its broader trend has not yet turned upward.| Metric | Reading |
|---|---|
| Latest price | $95.53 |
| Change | 1 day: +1.91% | 5 days: +2.76% | 1 month: -20.54% |
| Moving averages | SMA20: $100.46 | SMA50: $101.65 |
| Momentum | RSI: 45.6 | Stochastic %K: 45.8, %D: 32.9 | MACD: -4.463 |
| Key levels | Support: $85.49 | Resistance: $120.00 |
| Session | Wednesday, October 28, 2026 |
Summary Data INTC
| Last price | 95.53 USD |
| Change 1 day / 5 days / 1 month | 1.91% / 2.76% / -20.54% |
| Trend / MA-cross | downtrend / death |
| SMA20 / SMA50 | 100.46 / 101.65 |
| RSI (14) / Stochastic %K | 45.6 / 45.8 |
| Bollinger %B / ATR | 38% / 5.06 |
| Support / Resistance 20 days | 85.49 / 120.00 |
| Data as of | 29 October 2026 03:00 WIB |
Disclaimer: This technical analysis is generated automatically from exchange data (via Yahoo Finance) and indicators calculated by JournalArta, for information and education only. The verdict and the entry, target and stop-loss levels are not investment advice or a solicitation to buy or sell any security. Investment decisions and their risks rest solely with the reader.
Track INTC stock price daily: live levels, support/resistance and our full INTC analysis history.