TSLA Stock Gains 3.80% Today, Momentum Gains
On Agustus 14, 2026: price 339.96 USD, trend sideways, RSI 47.4, support 298.32, resistance 380.84. technical analysis of tsla stock. TSLA Stock Gains — full…

Tesla Inc. traded higher on Nasdaq on 13 August 2026, with TSLA last at $339.96 after a 3.80% daily gain, but the move still leaves the stock in a choppy middle zone rather than a clean breakout. The shares are now sitting above SMA20 at $331.07 and below SMA50 at $372.71, a positioning that signals short-term recovery inside a broader range trade, not a completed trend reversal.
Trend & Price Action
The key signal in the chart is not simply that Tesla rose; it is that the stock is trying to stabilize after a weak month. The 1-month change of -13.07% shows that recent strength is still working against a larger pullback, while the 5-day gain of 6.39% suggests buyers have returned with enough force to lift price back above the 20-day average. That matters because the 20-day line often acts as the market’s short-term “fair value” guide. When price is above it, traders are saying the stock is recovering faster than its recent average; when the slope of that average is still negative, as shown by the SMA20 slope of -4.67% over 5 days, the recovery is not yet fully trusted.
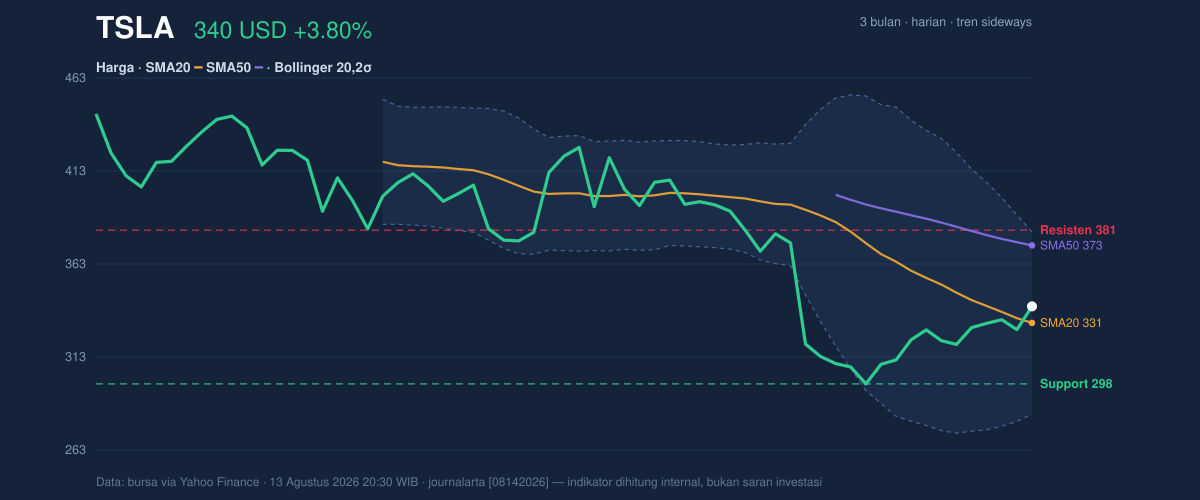
As shown in the chart, Tesla is also trading in the middle of its Bollinger structure, with %B at 59%. That means price is above the middle band but far from the upper band, so the stock is not yet stretched into a classic overbought breakout zone. The broader message is that the market has improved, but it has not yet proven it can hold above the recent congestion area near the upper half of the range.
The absence of a fresh moving-average crossover is another important detail. With no new MA-cross, the chart is not delivering a strong trend confirmation signal. Price above the 20-day average is constructive, but price still below the 50-day average tells readers the intermediate trend remains under pressure. In plain terms: Tesla has bounced, but it has not yet escaped the gravity of the longer trend.
Oscillators & Momentum
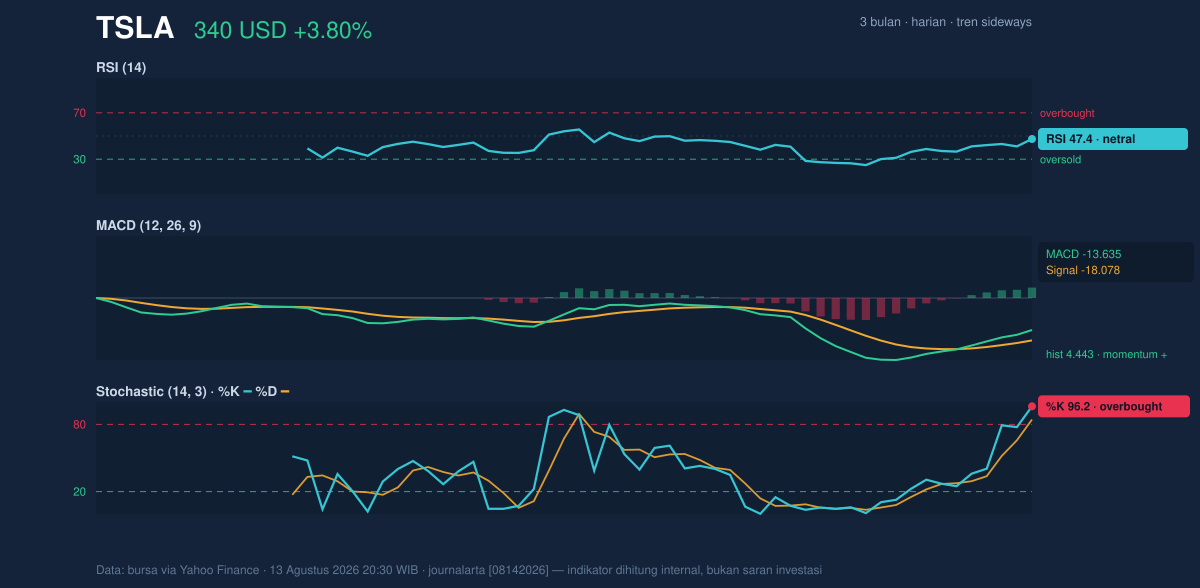
Momentum indicators are sending a mixed message, which is often what a transition looks like. The RSI at 47.4 is neutral, meaning the stock is neither overbought nor oversold on a standard momentum gauge. That usually signals balance: buyers and sellers are still contesting direction, and the market has not committed to an extreme.
The more striking signal comes from the stochastic oscillator, where %K is 96.2 and %D is 84.3. That is an overbought reading. In practical terms, it means the recent rally has been fast enough that short-term traders may already be crowded in. Overbought does not automatically mean a reversal, but it often means the stock is more vulnerable to pauses or pullbacks if fresh demand does not keep arriving.
The MACD line is the best evidence that the bounce still has some internal strength. With MACD at -13.635, signal at -18.078, and a positive histogram of 4.443, momentum has improved even though the indicator remains below zero. That combination matters: it shows the stock is still technically in a weaker medium-term state, but the pace of decline has eased enough for the MACD line to move above its signal line. This is often how a bottoming process starts — not with a dramatic breakout, but with the loss of downside momentum.
Volatility & Volume
Tesla’s volatility backdrop is still active. The Bollinger Band width of 29.6% shows the bands are expanding, which usually means the market expects larger price swings ahead. Expansion is important because it tells readers that the recent move is not happening in a sleepy environment; price can travel quickly if a catalyst appears. At the same time, ATR at 10.97 — about 3.2% of price — indicates the stock’s day-to-day range remains meaningful but not extreme relative to its own price.
Volume, however, tempers the enthusiasm. The latest trade volume of 34,575,700 was below the 20-day average of 39,122,495, or about 0.9x normal. That means the rally did not come with especially heavy participation. In technical analysis, price gains on lighter volume can still work, but they are less convincing than gains backed by clear crowd involvement. The positive counterweight is that OBV is rising, which suggests cumulative buying pressure has been improving even if the latest session did not show a volume surge.
Key Levels & Scenarios
The most important map points are clear. Tesla is trading above support at $298.32 and below resistance at $380.84, with the stock positioned around the midpoint of that range. The chart also shows the broader 3-month high at $451.98 and 3-month low at $297.38, which helps frame the recent move: the stock has rebounded away from the low, but it is still far from reclaiming the upper part of the range.
If price can continue to hold above $331.07 and push toward $372.71, the market would be signaling that the recovery is gaining enough structure to challenge the longer average. If that effort fails and the stock slips back under the 20-day band, the move would look more like a short-lived bounce inside a sideways market. A break below $298.32 would be a more serious warning because it would expose the area near the $297.38 three-month low.
Technical Verdict: HOLD (wait & see)
HOLD (wait & see)
- RSI is neutral at 47.4, so momentum is not strong enough to confirm a full trend change.
- MACD is improving with a positive histogram, but it is still below zero, which keeps the medium-term picture cautious.
- Stochastic is overbought, suggesting the recent bounce may be stretched in the short term.
- Verdict invalidated if price falls below $298.32, which would put the stock back into a weaker support zone.
- Ideal Entry Range: $331.07 to $298.32
- Exit Target (Target Price): $372.71 to $380.84
- Stop Loss protection: below $298.32
For non-traders, this means Tesla has improved, but the chart still needs more proof before the move looks durable.
Summary Data TSLA
| Last price | 339.96 USD |
| Change 1 day / 5 days / 1 month | 3.80% / 6.39% / -13.07% |
| Trend / MA-cross | sideways / none |
| SMA20 / SMA50 | 331.07 / 372.71 |
| RSI (14) / Stochastic %K | 47.4 / 96.2 |
| Bollinger %B / ATR | 59% / 10.97 |
| Support / Resistance 20 days | 298.32 / 380.84 |
| Data as of | 13 Agustus 2026 20:30 WIB |



